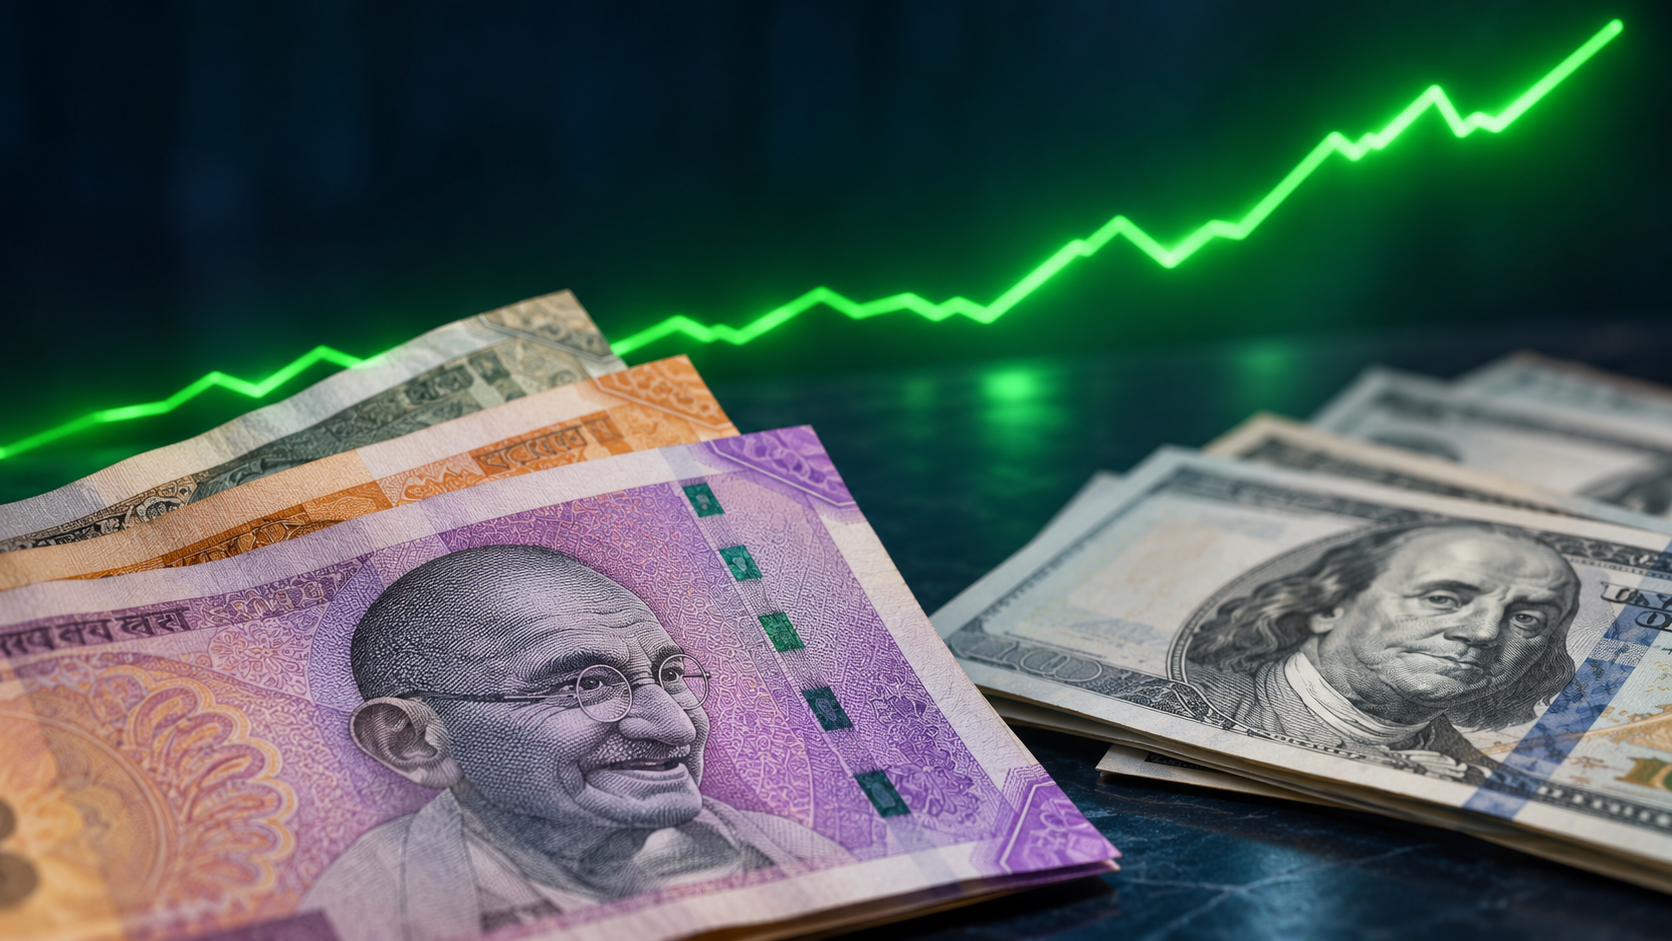

FundsIndia’s historical analysis shows that sharp corrections have often occurred during profitable years, although a recovery in 2026 remains uncertain.
Highlights
- Gold prices have declined sharply from their January peak.
- Mint reported Indian prices near ₹1.22 lakh per 10 grams on November 20.
- FundsIndia’s rupee-based analysis shows positive returns in 36 of 46 years.
- Gold has experienced an average intra-year drawdown of around 13%.
- A fall from the year’s peak differs from a calendar-year loss.
Gold’s sharp retreat from its January peak has raised questions about whether the precious metal can recover before the year ends. Mint reported prices near ₹1.22 lakh per 10 grams on November 20, citing bullions.co.in, roughly 32% below the January level of around ₹1.80 lakh. These are source-specific prices and should not be treated as a uniform jewellery rate across India.
However, historical data suggest that a steep fall during the year does not necessarily translate into a negative annual return.
What does the historical data show?
FundsIndia’s analysis records positive calendar-year returns for gold in 36 of the 46 years from 1980 to 2025, or approximately 78% of the period. The study uses international gold prices converted into Indian rupees, making the currency basis important when interpreting its findings.
The research also shows an average intra-year drawdown of around 13%. In other words, meaningful declines have been a recurring feature even when gold eventually finished the year higher.
A correction and an annual loss are different
An intra-year drawdown measures how far prices fall from an earlier high within the same year. A calendar-year return measures the change from the beginning of the year to its end.
For example, FundsIndia’s data show that gold suffered a 20% drawdown in 2008 but finished the year with a 29% gain. In 2020, it experienced a 15% decline during the year before recording an annual return of 28%.
Recovery has not happened every time. Gold ended 1981 with a 22% loss, while 2013 produced an 18% annual decline.
Can gold recover in 2026?
The current weakness comes amid a stronger dollar, elevated US Treasury yields and expectations of tighter monetary policy. Reuters reported that international gold had fallen 31.5% from its January record by November 16, illustrating the scale of the global correction.
For buyers, the distinction between international spot prices, domestic futures and local jewellery quotations matters. Taxes, purity and making charges also affect the final jewellery bill.
The historical record provides context for the decline, but the 78% figure is a description of past outcomes—not a forecast of the probability that gold will recover this year.