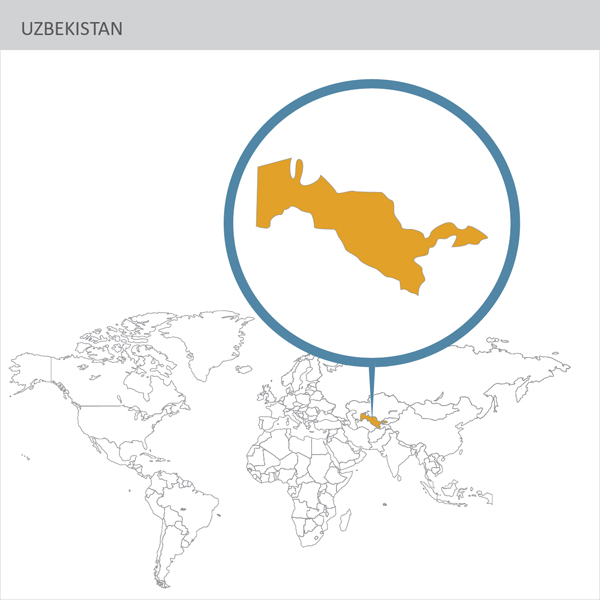

Uzbekistan spent most of the past 200 years as part of the Russian Empire, and then of the Soviet Union, before emerging as an independent state when Soviet rule ended in 1991.
Under authoritarian President Islam Karimov, who ruled from 1989 until his death in 2016, Uzbekistan was reliant on exports of cotton, gas and gold to maintain its rigid, state-controlled economy. President Karimov’s successor, Shavkat Mirziyoyev, has made efforts to break Uzbekistan out of its international isolation and economic stagnation, but has yet to initiate any serious political liberalisation.
| S.No | Parameters/Indicators | Figures/Facts |
| 1. | Population in million | 30.5 |
| 2. | GDP at current prices in US$ billion | 68 |
| 3. | Per capita GDP at current prices in US$ | 2,118 |
| 4. | GDP growth rate in 2017 | 6.5% |
| 5. | Total trade in US$ billion in 2017 | US$ 17 billion (exports at US$ 7.5 billion & imports at US$ 9.5 billion) |
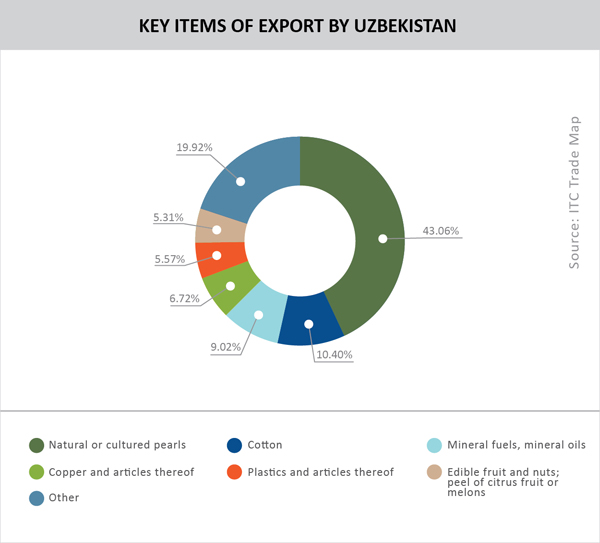
| 6. | Major exports | Gold, natural gas, polythene, natural uranium, cotton |
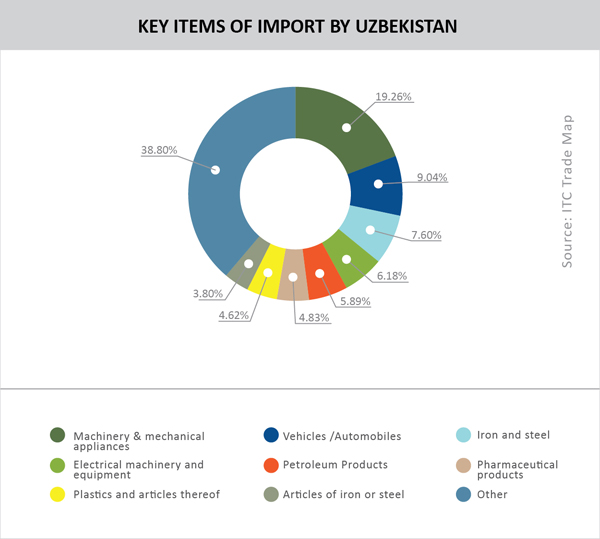
| 7. | Major imports | Medicaments, petroleum oils, accessories for tractors, flat rolled iron, wheat & meslin, motor cars, vacuum pumps, telephone sets |
| 8. | Major export destinations (share of imports) | Switzerland (38%), China (21.3%), Russia (10.1%), Turkey (9.4%), Kazakhstan (7.8%), Afghanistan (5.3%), Iran (1.3%)… India (0.6%) |
| 9. | Major importing economies from Uzbekistan (share of imports) | China (21%), Russia (20.5%), South Korea (9.8%), Kazakhstan (9.6%), Turkey (5.5%), Germany (5.2%)… India (0.9%) |
| 10. | FDI Stock | US$ 30 billion |
| 11. | Sectoral FDI | Mining, agriculture, energy technologies, renewable energy, water management technologies, infrastructure on renewable |
| 12. | Major economies investing | Russia, South Korea, Germany, USA |
Source: CATR Research
Uzbekistan is the 89th largest export economy in the world and the 96th most complex economy according to the Economic Complexity Index (ECI). In 2017, Uzbekistan exported US$ 8.38 billion and imported US$ 11.2 billion, resulting in a negative trade balance of US$ 2.84 billion. In 2017, the GDP of Uzbekistan was US$ 49.7 billion and its GDP per capita was US$ 6.87k.
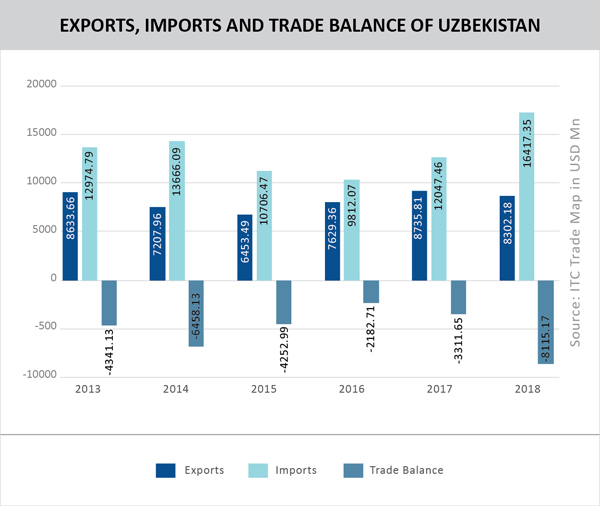
Exports of goods and services represented 20% of GDP in 2017 (US$ 11.38 billion in 2017). The country primarily exports energy products, cotton, gold, mineral fertilisers, ferrous and non-0ferrous metals, textiles, food, machinery, and automobiles to Switzerland (35.1%), China (19.7%), Russia (9.3%), Turkey (8.7%), Kazakhstan (7.2%), Bangladesh (5.4%), and Afghanistan (4.9%). Uzbekistan is the fifth largest exporter and seventh largest producer of cotton in the world.
Imports of goods and services represented around 20.5% of GDP in 2017 (US$ 11.44 billion). Imports include machinery and equipment, food, chemicals, ferrous and non-ferrous metals from China (22.2%), Russia (18%), South Korea (10.5%), Kazakhstan (10%), Turkey (5.8%), and Germany (5.2%).
The economy of Uzbekistan has an Economic Complexity Index (ECI) of -0.847 making it the 96th most complex country. Uzbekistan exports 110 products with revealed comparative advantage (meaning that its share of global exports is larger than what would be expected from the size of its export economy and from the size of a product’s global market).
Top Indian exports to Uzbekistan include pharmaceutical products, mechanical equipments, vehicles, service, optical instruments and equipment, while imports are dominated by fruit & vegetable products, services, fertilisers, juice products, extracts and lubricants. Exports from India to Uzbekistan stood at US$ 132.72 million during 2017-18, growing by 21.8% yoy. On the other hand, imports from Uzbekistan stood at US$ 101.67 million, growing by 118.45% yoy.
Last year, India and Uzbekistan signed 17 agreements across a comprehensive range of sectors including defence training, nuclear energy and military medicine. The two sides set a bilateral trade target of US$ 1 billion.
India-Uzbekistan Bilateral Trade
| India’s exports to Uzbekistan | India’s imports from Uzbekistan | ||||
| Products | Value in US$ million | Tariff | Products | Value in US$ million | Tariff |
| All products | 90.75 | All products | 46.5 | ||
| Medicaments | 24.6 | 5 | Dried, shelled beans | 17.9 | 8 |
| Chassis fitted with engines | 10.2 | 17 | Potassium chloride | 7.9 | 30 |
| Pro-vitamins & vitamins | 5.4 | 5 | Lac; natural gums | 5.2 | 5 |
| Vaccines for human medicine | 5.03 | 5 | Urea | 4.1 | 8 |
| Antibiotics | 3.77 | 5 | Crude natural potassium salts | 2.32 | 5 |
| Cumin seeds, neither crushed nor ground | 1.92 | 10 | Unwrought zinc | 1.9 | 0 |
| Household refrigerators | 1.61 | 11 | Cotton, neither carded nor combed | 1.4 | 10 |
| Refractory bricks | 1.5 | 5 | Raw silk | 1.05 | 5 |
| Transmission shafts | 1.5 | 5 | Unwrought lead, refined | 0.980 | 30 |
| Road tractors for semi-trailers | 1.5 | 26 | Plants, parts of plants, incl. seeds and fruits | 0.963 | 8 |