

• A net food exporting economy like India must also be able to meet the standards and specifications required by a net food importer economy, as they are heterogeneous across the globe. • A true reform in agriculture is only possible when the global community accepts the guiding principle that food for all is an international obligation. • Industry stakeholders from the growing, processing and food service/retail sectors are using cold chain systems, Hazard Analysis and Critical Control Points (HACCP) and other food safety management systems (FSMSs), such as the newly established ISO 22000 as models to achieve food safety and to enhance trade opportunities in international markets. • The targets are quick (deep) frozen, frozen and foodstuffs that need to be transported at refrigerated temperatures. Chilled foods would include dairy products (pasteurized, industrial or raw milk, butter, yogurt, kefir, cream, fresh cheese), meat products, poultry, offal, game, fish and seafood. Agriculture in the twenty-first century is reinventing itself as a new global business reshaped by globalization, standardization, high-value production, massive growth in demand (both for the food and the biofuel industries), retail and packaging innovations, and a ramp up in efficiency. Faced with constant productivity and market pressures, this “new agriculture” needs new tools to enhance its competitiveness and innovation capacity. One of these tools is the promotion of clusters. An agro-based cluster (AC) is simply a concentration of producers, agribusinesses and institutions engaged in the same agricultural or agro-industrial sub-sector, and interconnect and build value networks when addressing common challenges and pursuing common opportunities. This cluster is identified on the basis of crops, which an economy can produce, but this is not matched with the global demand. Mapping of requisite food products, which are demanded by the net food importing economies is missing in the working mechanism of clusters. An agricultural enclave is an analogous concept with some augmentations. To bolster economy-specific agricultural exports, an economy needs to prepare itself to match all standards and quality. For example, if Japan & Singapore are net food importer economies, this signals opportunities for a net food exporting economy like India. This might look little guileless, but pragmatically it is a daunting sphere. India must cater to net food importing economies In a world where over 800 million people across many countries – particularly in Africa and Asia still suffer from hunger, one of the principal aims of the agricultural and trade policy must be to improve nutrition – quantitatively and qualitatively. In view of these challenges, agricultural trade is often the subject of polemical debates in civil society because of its particular role in food security. This is partly because agricultural trade can have very diverse impacts, helping to address food shortages, but also potentially leading to unwanted dependency. Agricultural protection continues to be the most procrastinated issue in global trade negotiations. Although protection for manufacturing products in both industrial and developing countries has declined significantly and overall trade reforms have been adopted in developing countries, agricultural protection in industrial countries has changed very little. Industrial countries supported their agricultural sectors through subsidies to producers, high tariffs and other non-tariff measures such as import restrictions and quotas. While this protection was acknowledged in economic literature and in global discussions, its implication for developing countries received much less attention. Learning from Common Agricultural Policy – EU’s Approach The six member states have strongly intervened individually in their agricultural sectors, in particular with regard to what is produced, maintaining prices for goods and how farming is organized. The intervention posed an obstacle to free trade in goods while the rules continued to differ from state to state since freedom of trade would interfere with the intervention policies. Some members, particularly France, and all farming professional organisations wanted to maintain strong state intervention in agriculture. That could not be achieved unless policies were harmonised and transferred to the European Community level. By 1962, three major principles had been established to guide the Common Agricultural Policy (CAP): market unity, community preference and financial solidarity. Since then, the CAP has been a central element in the European institutional system. A modern CAP that delivers good food and helps farmers in the transition to sustainability must find an alternative to inefficient tools like the current direct payments. A true reform in agriculture is only possible when the global community accepts the guiding principle that food for all is an international obligation. It can only be achieved when the need for national food self-sufficiency becomes the cornerstone of the WTO’s Agreement on Agriculture. And it can only be put into practice when the developed and developing countries refrain from a battle of food supremacy to re-orient efforts to bring equality. Tie-ups with food regulatory authorities of food importing economies Food safety stakeholders in the global food supply chain industry, regulators, international standard-setting agencies and researchers have responded to the need for improved food safety assurance to support international trade in a variety of ways. Industry stakeholders from the growing, processing and food service/retail sectors are using cold chain systems, Hazard Analysis and Critical Control Points (HACCP) and other food safety management systems (FSMSs) such as the newly established ISO 22000 as models to achieve food safety to enhance trade opportunities in international markets. Advanced knowledge of food hazards has resulted in new regulations, which includes mandatory HACCP system implementation in processing plants in several countries. Food laws aim to protect consumers’ interests, their well-being, and to a degree, facilitate fair trade. Food safety-related legislation is continually under review as it needs to reflect new knowledge, technical innovation and changes in the pattern of the distribution. As a result, national regulatory authorities throughout the world are in a constant catch-up mode. Similarly, international food safety standard-setting bodies look to address current issues and to develop guidelines on systems and methods that will help streamline best practices in food safety within and between several economies. Other proposed Codex Alimentarius codes of relevance to chilled and frozen food production

US-China Trade War: Mixed blessing for India
• China & US have indulged in a series of tit-for-tat tariff measures over the last few days, escalating their trade war, which began sometime around Jan’18. • This ensuing imbroglio is likely to have major repercussions for the global trade landscape, as well as for India. • India stands to benefit from this trade row, in terms of potential for increased exports, but also needs to guard against dumping of commodities by China. • An analysis by CATR projects higher potential gains from exports by India to US (US$ 2.25-5 billion) as compared to China (US$ 1.6-4.96 billion) due to the ongoing trade war. The last few days have witnessed an interesting turn of events in the trajectory of trade tensions between the world’s top two economies – US & China. With the US government deciding to increase tariffs on US$ 200 billion worth of Chinese goods from 10% to 25% citing the lopsided nature of this trade, protection of its economy from IPR theft by leading Chinese firms & an unfavourable balance of payments, this battle has new chapters unfolding. This move led to a hike in tariffs by China, which accuses US of engaging in unilateralism and protectionism. These tariffs on US$ 60 billion worth of US goods will be effective from June 1, 2019 and vary between 5% & 25%, according to China’s Tariff Policy Commission of the State Council. This further led to a proposal by the US Trade Representative (USTR) to increase tariffs levied on 3,805 Chinese imports, pegged at about US$ 300 billion. The ongoing confrontation between the two giants is likely to have a ripple effect on the global economy. According to a report released by the International Monetary Fund, this tension is already responsible for a “significantly weakened global expansion”. Some of the other possible international implications of this war include the re-pricing of risk assets globally, stricter financing conditions, slower growth, a fragmented global trading framework and weakening of trade rules. However, the situation also presents a golden opportunity for India. According to UNCTAD estimates, EU (US$ 70 billion) & Japan (US$ 20 billion) are most likely to reap the benefits of this impasse. But India’s exports are also anticipated to grow by around 3.5%. The silver lining for India The good news for India is that this hike in tariffs is not likely to re-route manufacturing back to US. Higher wages in US had prompted it to outsource production to commercially viable locations like China. But in the aftermath of this trade war, US companies will have to turn to other cost-effective production centres like India. A few tech giants have already taken steps in this regard. For instance, Apple has shifting their base to India’s Silicon Valley, Bangalore, for the production of iPhones. The US-India Strategic & Partnership Forum (USISPF) has affirmed that around 200 US companies are looking to shift base from China to India. India stands to gain from enhanced exports to both the US and China. A study by Centre for Advanced Trade Research (CATR), the in-house research division of TPCI, concludes that the potential gains from enhanced exports to US will be higher than the corresponding gains from enhanced exports to China. According to the report, India can gain between US$ 1.6 billion to US$ 4.96 billion from increased trade with China in this scenario, while it can gain between US$ 2.25 billion & US$ 5 billion from its exports to US (based on calculation of realistic vs optimistic scenarios). Potential product categories for enhanced exports to the US include motor cars, wooden furniture, chemicals, apparel and clothing, toys, games and sports, plastics, rubber, footwear, fish and paper. In the case of China, India can improve its exports in product categories like plastics, organic chemicals, pharmaceutical, fish grapes and carpets. The current scenario also presents a great opportunity for foreign investors in India. As Lei Jun, the founder of Xiaomi points out, India is one of the leading markets for the mobile phone firm and it stands to attract large investments from China in the face of the current spat. A consequence of the increase of this investment, coupled with a shift of labour-intensive production out of China, is the creation of lakhs of blue & white collar jobs for Indians. Mahindra Group Chairman Anand Mahindra seconds this view, and comments, “Even if they settle (US and China), a Chinese firm with large exports to the US would be wise to hedge & invest in a subsidiary in India & transfer its scale-manufacturing skills… A wave of Chinese investment in India may be imminent…” While the locking of horns of China & US is, overall, a beneficial situation for India, the country needs to address a few structural bottlenecks in order to make the most of this situation. For instance, India needs to watch out for the stiff competition from other cheap labour markets like Vietnam, Cambodia, Thailand & Bangladesh. The creation of textile SEZs, exporting fabrics other than just cotton, imparting relevant skills to the workforce & modernisation of production technology are some of the urgent measures that must be taken to tackle the situation. India also needs to be mindful of possible devaluation of the yuan, necessitating a devaluation of the rupee to protect the interests of Indian exporters. According to an analysis by Indian Ratings and Research (Ind-Ra), inflationary pressures in the US could lead to weaker foreign portfolio investments by it in emerging economies like India. Last, but not the least, the interests of domestic commodity sectors like steel, aluminium and copper need to be protected in particular, as there is a high probability of an increase in dumping of these products by China.

Electronics exports: Positive signs, but many miles to go
• India’s merchandise exports grew at just 0.64% YoY in April 2019, after recording a strong YoY growth of 8% during the previous fiscal year. • Among the bright spots in this sobering performance is the electronics sector, where exports registered a strong growth of 27.78% YoY. • The electronics manufacturing ecosystem in India has evolved at an impressive pace over the last 4-5 years, leading to a rise in indigenous development of completely built units (CBUs). • India needs to leverage its strengths in terms of engineering talent pool and R&D base to plug into regional value chains and become a hub for electronics exports. India’s exports posted a strong growth of around 8% YoY in 2018-19 to reach US$ 535.45 billion. But after that stellar performance in the face of inimical global trade winds, the current financial year has started on a sobering note for Indian exporters. Merchandise exports grew by just 0.64% YoY in April 2019 in dollar terms to reach US$ 26.1 billion, while imports grew at a stronger rate of 4.5% YoY to US$ 41.4 billion. This took the merchandise trade deficit to US$ 15.33 billion in April, compared to just US$ 10.9 billion in March. Major product categories suffering negative growth were rice (-8.43%), other cereals (-44.7%), oilmeals (-20.6%), coffee (-12.73%), leather & leather products (-15.25%), gems & jewellery (-13.38%), mica, coal & other ores (-16.43%), marine products (-6.23%) and engineering (-7.1%). Top gainers in exports for April 2019 Commodity Exports in April 2019 (US$ million) Exports in April 2018 (US$ million) Gain (YoY in %) Tea 49.8 64.9 30.32% Iron Ore 86 198.45 130.76% Ceramic products & glassware 184.33 224.39 21.73% Electronic goods 559.6 715.06 27.78% Petroleum products 2812.98 3677.89 30.75% Source: Department of Commerce However, there are positive aspects in the April numbers, like the growth in agricultural and plantation commodities like tea (30.32%), spices (6.5%), fruits & vegetables (5.86%) and meat, dairy & poultry products (1.43%). One prominently positive trend that’s hard to miss in the figures is the growth in electronic goods exports by 27.78% YoY in April. This is a continuation of the performance in the previous fiscal, when electronic exports grew by 39% yoy to a record US$ 8.9 billion. This should be an optimistic development for more reasons than one, especially because India’s rising electronics import bill has been a major source of concern for policy makers in the past few years. According to analysts, the more interesting part is the fact that imports of components are rising faster than imports of completely built units (CBUs), which essentially means that more of finished products are being manufactured within India itself. Telecom instruments, which constitute around a third of electronics imports, witnessed a drop in imports by nearly 15% during April-February, 2018-19. On the other hand, exports in the product category (including mobile phones) increased by a huge 129% yoy to US$ 2.4 billion, which is the highest since FY’14. Overall, electronic imports witnessed a slowdown in growth from 23% YoY in 2017-18 to 8% in 2018-19, reaching US$ 46.8 billion. In terms of manufacturing, the target for FY 2019-20 of mobile phone manufacturing of Rs 1.5 lakh crore and component manufacturing of Rs 50,000 crore was achieved one year in advance. Moreover, import of CBUs, which was over 75% at one stage, has come down to 10%. In 2014, India had only three manufacturing units in comparison, and handset manufacturing had reached a low of 58 million. By 2017-18, the number grew once again to 225 million handsets, with India overtaking Vietnam to become the second largest mobile handset manufacturing destination. According to estimates by the Indian Cellular & Electronics Association, there are around 268 mobile and accessories factories in India presently, which provide employment to over 6.7 lakh people. Going forward, India has the potential to open 1,800 more such factories and provide around 50 lakh jobs in the coming 6-7 years. The Government of India launched its National Electronic Policy in 2019, which aims for a turnover of US$ 400 billion from domestic manufacturing by 2025, apart from establishing a cluster for the entire value chain and employing over 1 crore people directly or indirectly. The policy incorporates various support mechanisms like interest subvention for manufacturers, credit guarantees, cost-effective loans, fresh manufacturing clusters and the creation of a sovereign patent fund. While the National Electronics Policy is trying to ensure end-to-end manufacturing capabilities, the industry also needs to move towards indigenous designing as opposed to just assembly. The Phased Manufacturing Programme (PMP) helped bring down imports in 2018-19, but boosting electronic exports will require a combination of vision, strategic planning and efforts from all stakeholders. The budding Indian electronics manufacturing ecosystem provides a tremendous opportunity to MNCs looking for a lucrative manufacturing destination. India can look to script a success story similar to Vietnam, which boosted its electronics exports by more than 700% between 2000 and 2016. Vietnam’s success has a lot to do with the impact of rising FDI facilitated by favourable government policies. India already has a strong talent pool of engineers, which has led to a number of MNCs setting up R&D hubs in the country. Already, companies like Samsung, LG, Apple and Xiaomi have established an R&D presence in the country. The government has also facilitated these companies in moving towards futuristic innovation, by instituting measures like instant approval for 5G-based R&D activities and field trials. It is important to leverage these strengths with the right policy framework and facilitating environment in order to help manufacturers integrate into regional value chains in Asia and boost exports. This is important not just to tackle current challenges of high imports, but also to keep the Indian industry in step with the fast evolving technology landscape globally, which is moving to new paradigms like internet of things (IoT) and AI (Artificial Intelligence).
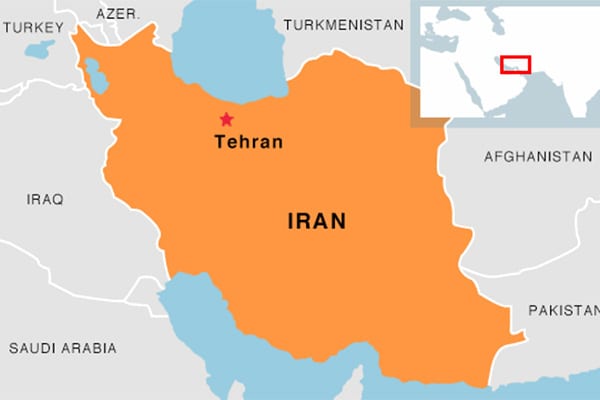
Country Profile: Iran
• Iran has an Economic Complexity Index (ECI) of -0.158, making it the 66th most complex country. Its economic freedom score is 51.1, making its economy the 155th freest in the 2019 Index. • Iran’s main imports are machinery, cereals, iron and steel, and chemicals. Major import partners are the UAE, China, South Korea, Turkey and Germany. • Iran is a founding member of the Economic Cooperation Organisation (ECO) and Organisation of the Petroleum Exporting Countries (OPEC). • Sanctions previously imposed by the UN, US and EU in an attempt to force Iran to halt uranium enrichment crippled its economy, costing the country more than US$ 160 billion in oil revenue from 2012 to 2016 alone. Iran is located in Western Asia sharing border with the Caspian Sea, Oman and Persian Gulf. A unique feature of Iran’s economy is the existence of large religious foundations called Bonyad, whose collective budgets represent more than 30% of central government expenditure. In recent years, the country’s economy has declined as oil exports fell significantly following international sanctions imposed in the context of nuclear development. Iran has the third largest proven gas and oil reserves in the world. Oil and natural gas are Iran’s most important exports along with chemicals, plastics and fruits. Iran majorly exports to Taiwan, China, Turkey, South Korea and India. Iran’s main imports are machinery, cereals, iron and steel, and chemicals and major import partners are the UAE, China, South Korea, Turkey and Germany. Iran is a founding member of the Economic Cooperation Organisation (ECO) and Organization of the Petroleum Exporting Countries (OPEC). Iran’s import basket Iran’s export basket S No Product description Values in US$ billion, in 2018 S No Product description Values in US$ billion, in 2018 1 Total products imported by Iran 41.10 1 Total products exported by Iran 66.62 2 Machinery and mechanical appliances 7.76 2 Petroleum and crude oil & mineral fuels 53.24 3 Automobiles 4.04 3 Plastics and plastic products 3.30 4 Electronic products 3.69 4 Organic chemicals 2.05 5 Cereals 3.75 5 Ores, slag and ash 1.77 6 Optical, medical and surgical instruments 1.50 6 Iron and steel 1.30 7 Articles of iron and steel 1.48 7 Edible fruit and nuts 0.96 Source: ITC Trade Map, 2019 Iran’s trading partners Iran’s top exporting destinations Top economies from where Iran imports S No Economies Values in US$ billion, in 2018 S No Economies Values in US$ billion, in 2018 1 China 16.95 1 China 13.11 2 India 12.85 2 UAE 8.20 3 South Korea 7.22 3 South Korea 3.68 4 Italy 3.48 4 Turkey 3.20 5 Japan 3.23 5 Germany 3.10 6 France 2.40 6 India 2.95 Source: OEC Data The economy of Iran has an Economic Complexity Index (ECI) of -0.158 making it the 66th most complex country. Iran’s economic freedom score is 51.1, making its economy the 155th freest in the 2019 Index. Macroeconomic indicators of Iran Population 82 million people GDP at PPP US$ 1.6 trillion Per capita income at PPP US$ 20,200 Unemployment 12.5% GDP growth rate 3.6 – 4.3% FDI inflow US$ 5 billion % of population living below poverty line 19.5% % of GDP contribution by agriculture, industry and services 9.8%, 35.9%, and 54.3% respectively Iran sanctions story The history of US sanctions against Iran dates as far back as 1979, when detainees were held at the US embassy in Tehran. Over the years, the US government has approved other sanctions. In 2010, amid increasing tensions of Iran’s nuclear program, the US instituted sanctions that its own officials described as ‘unprecedented’. The United Nations and the European Union, and other countries around the world also have sanctions against Iran. Sanctions previously imposed by the UN, US and EU in an attempt to force Iran to halt uranium enrichment crippled its economy, costing the country more than US$ 160 billion in oil revenue from 2012 to 2016 alone. Last year, when US announced sanctions on Iran once again, Britain, France and Germany issued a joint statement saying they will maintain economic ties with Iran despite the threat of American retribution. Also post the joint comprehensive plan of action (JCPOA) EU lifted the sanctions but USA is still continuing to do so and also creating a pressure on other economies to second it. Table 1: Summary of Sanctions on Iran Time Line Country implemented/reasons 1979 For the first time, US imposed sanctions, due to which Iranian imports to the United States were banned and US$12 billion in Iranian assets were frozen. 1984 Due to “support for acts of international terrorism”, USA imposed sanctions on Iran. 1992 Due to the Iran-Iraq Arms Non-proliferation Act of 1992, USA opposed Iran 1997 US President Bill Clinton issues executive orders to generally prohibit the trade of all goods and services between the United States & Iran. 2006 UN imposed sanctions on Iran 2007 The European Union has augmented UN penalties against Iran with sanctions that are “nearly as extensive as those of the United States Current Sanctions Implemented by US Iran Sanction Story-Tussle for India India’s exports to Iran were recorded at US$ 2.85 billion in 2018. The major products of export were cereals (US$ 1.2 billion), organic chemicals (US$ 156.32 million), coffee, tea, mate & spices (US$ 149.1 million) and electrical machinery and equipment (US$ 147.7 million). Iran was the largest importer of Basmati rice from India with total imports of US$ 1.56 billion in 2018-19 (DGCIS). India is heavily dependent on oil imports from Iran at present, which were available on favourable terms until the US ended its sanction waivers recently. This is expected to raise oil prices in India in the aftermath of the elections. The first phase of the Chabahar Port was inaugurated in December 2017. The India Ports Global Chabahar Free Zone (IPGCFZ) commenced operations in January this year. The commencement of commercial operations marks a historic step, with India now at the forefront of regional efforts to support land-locked Afghanistan. Chabahar is easily accessible from India’s

Will Iran crude supply constraint impact India?
• India is overdependent on Middle East and OPEC countries for crude imports. Destinations like Saudi Arabia, UAE and Iraq are reasonably stable and less prone to geopolitical disturbances. • With the end of sanction waivers by the US, Iranian crude of 22.5 million tonnes will vanish from the crude basket of Indian refiners. • Increasing purchase from Iraq and Saudi Arabia to offset the loss of Iran crude could go against the fundamental of widening the crude sourcing basket. • On the other hand, the loss of Iranian crude could open potential opportunities to import more from Nigeria, Kuwait, Angola, Venezuela, Russia, and the USA. India’s vibrant democracy is currently deeply involved in the last leg of celebrating the biggest festival of exercising democratic rights through general election. During the election time, many important issues often take backstage, but not crude oil sourcing, pricing and its strategic implications. Especially, when the matter involves the United States, nothing can be passive for policy makers, investors, analysts, and readers. The Trump Administration is fully geared to reinforce the United States’ objective of blocking Iranian crude to the international market. By virtue of sanctions on Iran, flow of Iran crude to the international market is completely blocked; there is no extension of waiver to any of the countries including India, Japan, and China. Both China and India are forced to redefine their oil diplomacy with Iran. India being one of the biggest importers of Iranian crude is forced to rejig its crude import strategy. Stoppage of Iranian crude to Indian refineries is poised to adversely impact refinery crude sourcing plan and to a certain extent refinery economics. In the long run, refiners must adapt to geopolitical changes and revisit their crude sourcing strategies to countervail loss of Iranian crude. Indian economy is inching closer to three trillion dollar mark and the World Bank forecasts 7.5 per cent growth rate through 2021. Steady economic growth demands higher consumption of energy in agriculture, industries, manufacturing, construction, and other important sectors. As evident from the historical primary energy consumption statistics, India still heavily dependent on fossil fuel. Today, oil remains as the most preferred fuel for transport sector, which may not change in the immediate future. Government’s intention to cut down oil import is plagued by domestic production slump. Indigenous crude production has fallen from 38.1 million metric tonnes (MMT) in 2010-11 to 35.7 MMT 2017-18, a shortfall of 2.4 MMT during the period. Consequent to rising oil demand and falling domestic production, India’s crude oil import has been steadily increasing. By the end of March 2019, India imported 226.6 MMT of crude oil compared to 163.5 MMT in 2010-11. India’s overdependence on Middle-East and OPEC countries for crude import is a harsh reality. Crude sourcing destinations like Saudi Arabia, United Arab Emirates, and Iraq are reasonably stable and less prone to geopolitical disturbances. Whereas oil resource rich destinations like Venezuela and Iran are susceptible to local socio-economic disturbances as well as global or regional geopolitical disorders. The deteriorating relationship between the USA and Iran puts Asia in a challenging position. Despite Asia being the emerging oil demand centre, large importers like China, India, and Japan failed to influence the Trump administration on extending the sanction waiver period of 180 days ending early May 2019 and there is no certainty about restoration of waivers. Indian refiners anticipated the inevitable sanction on Iranian crude. In 2017-18, India imported 22.5 MMT of crude from Iran, which is 10.2 per cent of total crude import. Suddenly, Iranian crude of 22.5 million tonnes will vanish from the crude basket of Indian refiners. Presumably, they are better prepared to overcome Iranian crude supply constraints. There are multiple options, which include increasing purchase from Iraq and Saudi Arabia to offset the loss of Iran crude. However, such a choice could go against the fundamental of widening the crude sourcing basket. Any additional purchase from Saudi Arabia means that India’s crude oil import dependence could exceed beyond 20 per cent of India’s total crude import. It certainly may not be the wiser decision in the long run, but in the short-run it looks viable. It seems some refineries have adopted increasing intake from Saudi Arabia. Further, in such circumstances, some refiners might increase purchase from the spot markets rather than entering into any long-term contract. In terms of dollar value, since 2016-17 Iran has been the third largest source of crude supplier to India. Forced absence of Iranian crude could hurt Indian refiners. On the other hand, loss of Iranian crude could open potential opportunities to import more from Nigeria, Kuwait, Angola, Venezuela, Russia, and the USA. Diplomatic channels must be kept open to persuade Trump administration to revisit the decision in the interest of global economic prosperity. India’s Top 20 Sources of Crude Import (Value, Million USD) 2013-2014 2014-2015 2015-2016 2016-2017 2017-2018 2018-2019 (April-Jan) Iraq 18,348.42 14,174.33 10,758.45 11,616.72 17,544.24 18,789.93 Saudi Arabia 30,964.24 21,803.40 13,489.47 13,674.09 15,262.60 18,217.56 Iran 8,443.97 7,039.69 4,283.77 8,908.61 8,978.76 10,933.55 Nigeria 13,510.42 12,935.05 9,017.85 6,748.95 8,192.30 7,728.68 Venezuela 13,936.55 11,597.91 5,678.63 5,505.88 5,859.30 6,235.33 Kuwait 15,150.28 11,478.90 3,588.91 2,946.39 5,283.96 4,332.20 Angola 5,935.79 4,418.29 2,659.17 2,146.34 3,080.08 3,409.37 Mexico 2,961.86 2,684.27 1,378.88 1,842.30 2,751.73 2,993.18 Oman 1,339.36 561.98 133.78 155.33 2,413.73 2,852.62 Brazil 1,995.71 2,510.81 1,240.34 1,334.64 1536.47 2,115.25 Malaysia 1,822.18 2,464.82 1,286.49 1,979.26 1,386.97 1,276.65 Qatar 4,315.40 2,301.40 1,480.28 1,654.04 1,264.98 1,184.39 Russia 82.03 170.83 71.54 300.8 1,169.30 1,045.49 Algeria 323.73 347.15 204.09 494.41 867.18 1,024.72 Kazakhstan 563.13 554.87 261.03 337.27 700.26 848.4 USA 0 0 15.74 0 609.47 671.97 Equatorial Guinea 298.92 745.56 316.79 452.06 383.42 669.97 Gabon 790.43 726.14 29.49 30.07 266.17 515.48 Ecuador 194.8 962.33 437.56 219.16 84.9 462.32 Libya 427.02 57.58 68.72 457.87 Source: Ministry of Commerce, India India is an oil resource deficit nation, always over exposed to tight oil supply scenario; especially when any oil resource rich nation is placed under sanction. Stressed global oil supply conditions might escalate prices. It is understood that the US is on
India’s CPI inflation below target, but could get worse
• India has witnessed a 6-month record surge in consumer price index (CPI)-based inflation and retail inflation in April’19. • The main cause for this inflation is the rise in food and fuel prices over the last six months. At the same time, there has also been a slowdown in industrial production in a few sectors. • Increase in prices in these sectors, in turn, has been the product of a number of intrinsic and extrinsic factors. • Slowing growth may compel RBI to cut rates during its next review in June 2019, but it must also weigh in the impending rise in crude prices. The Indian economy witnessed an upsurge in consumer price index based inflation, which rose from 2.86% in March’19 to 2.92% in April’19, the maximum rise in the last six months. The key contributing factors include growth in the food and beverages segment and mounting fuel prices. Parallelly, retail inflation quickened to a six-month high of 2.92% in April’19 according to data released by the Central Statistics Office (CSO). This is in sharp contrast to January’19, when it plummeted to a low of 2.05%. At the same time, it is well below the RBI mandated inflation target of 4%. The findings of CSO suggest that food price inflation accelerated by 1.38% in April compared to 0.66% in March. Prices of a number of agricultural products have steadily risen over the last few months, due to structural supply constraints. These include a host of farm commodities including coarse grains, cattle feed ingredients, fruits, cotton and seasonal vegetables. While agro-climatic factors such as drought in major parts of Maharashtra, Gujarat, Karnataka, Andhra Pradesh and Telangana have triggered bottlenecks in supply; sustained low production practices are also believed to have contributed to the same. These are indubitably bound to impact yields and supply chain. At the same time, given the possibility of a bleak monsoon in the face of an El Nino event, CRISIL predicts that food inflation will rise further. The fuel and light segment also saw inflation increase to 2.56% from 2.34% during the period between March’19 & April’19. Myriad international developments over the past few months have contributed to the rise in fuel prices, including military action in Libya, supply cuts from OPEC and slowdown in crude production in Venezuela due to imposition of US sanctions. The recent source of turbulence in the international oil market, which could send prices soaring in India are the sanctions by US against Iran. Washington has lifted waivers that allowed Tehran to indulge in oil trade with other countries. This will have a major impact on India, since it is the second largest importer of crude from Iran. There is a general understanding that fuel prices will rise after the wrapping up of the 2019 general elections. The age-old inflation-growth conundrum At the same time, the Index of Industrial Production (IIP) data points out that the country’s industrial output declined by 0.1% in March’19, hitting a 21-month low. This has been associated with contraction in manufacturing (0.4%), capital goods (8.7%) and consumer durables (5.1%). The previous low for IIP was a 0.3% decline recorded in June 2017. Industrial credit is constrained, making life tough for MSMEs in particular. The slowdown in the private sector can be gauged from the fact that new investment proposals were recorded at Rs 9.5 lakh crore in 2018-19, compared to an average of Rs 25 lakh crore during 2006-07 to 2010-11. GDP is expected to have slowed down for the fourth consecutive quarter to 6.5% in the three months ending March 2019, and Credit Suisse estimates the sluggishness to continue for a year due to high interest rates and stress in state-run and shadow banks. The debacle facing NBFCs is also impacting consumer credit, which is consequently hurting dependent sectors like consumer durables and automobiles. Total automobile industry sales slid by nearly 16% in April, according to data from SIAM, while consumer durable output dropped by 5.1% YoY. But the malaise is actually wider if you consider the FMCG sector, wherein leading companies like HUL, Godrej Consumer Products Ltd, Dabur and Britannia showing a substantial decline in volume growth; led in particular by slowdown in rural consumption. The Reserve Bank of India, is set to have its next Monetary Policy Committee meeting on June 6. In the light of weak industrial growth and inflation being still below target, it is likely that the RBI will cut rates, injecting more liquidity into the Indian economy and creating channels for growth. However, it will also have to consider what the data portends on inflation expectations going forward, especially with the possibility of rising crude prices.

An ASEAN sojourn for Indian aviation
• The air transport industry now supports 63 million jobs and contributes US$ 2.7 trillion to global GDP. • India is missing out on the opportunities presented by the growth in the aviation sector across the globe. • With the upcoming open skies policy in the ASEAN nations, Indian airlines have a strong opportunity to expand their horizons in the region. • The Indian government must provide adequate support and cooperation to these players to explore the ASEAN market. Creation of an energetic and competitive services sector is fast becoming a key characteristic of modern economies. For more than two decades, advanced economies are frequently accounting for two-thirds or three-quarters of services as the overall economic activities of GDP. The transition from agriculture through manufacturing to a services economy has been the hallmark of economic development for many countries. In line with this trend, it has been noticed that many emerging markets are currently undertaking serious efforts to support and develop services industries, and to put in place the regulatory structures required for more integrated international services markets. India and the Association of Southeast Asian Nations (ASEAN) are largely following this trend to make services sector to drive their economic integration with the world economy and potential trade partners. Many emerging economies from ASEAN region and India are currently focusing on the growth of the services sector. This is evident from the fact that India’s contribution of services sector to GDP is overwhelming and bordering around 63% (Kapoor, ICRIER 2014), thus contributing to economic activity, employment and growth. Looking at the business potential and trade opportunities, the ASEAN region has a significant contribution of the air transport services industry to its GDP. It shows an upward and lucrative trend, marked by robust growth; particularly in certain emerging markets of the ASEAN region and more so in Singapore, Indonesia and Thailand. While the global air cargo segment still persists somewhat at abated expectations, passenger progression is showing an upward trend and air travelers are forecasted to double by 2035. The air transport industry now supports 63 million jobs and contributes US$ 2.7 trillion to global GDP. Considering the prospects in the ASEAN region, competency levels of Indian air services and the open sky policies adopted by ASEAN countries, India is in a comfortable position to explore opportunities to provide air services in that part of the world. Therefore, with the signing of India-ASEAN agreement, India should start negotiating to take full advantage of the sector. Of course, a substantial part of negotiations in services between ASEAN and India haven’t generated much interest, neither among industry nor government. Though both have shown keen interest in the area, governmental or industrial levels talks between the two regions have only led to understanding the potentiality. Both are convinced that the regions offer considerable opportunities, which need to be exploited. Indonesia a lucrative market One of the key players in ASEAN countries currently is Indonesia whose requirement in air services (air transport) is immense. The National Input Output Table provided by World Input Output Database reveals that this industry was worth US$ 2.28 billion in 2000 in terms of domestic value addition and US$ 0.44 billion in terms of imports. In subsequent years (2001 to 2005) domestic value addition and imports shrank, reducing the difference between exports and imports to almost nil. From 2006 onwards, it showed a consistent rise to increase domestic consumption of air services to US$ 18.5 billion whereas the import component prevailed at US$ 0.53 billion in 2014. So, the domestic consumption of air services and import of services witnessed a CAGR of 53% and 1.2%; whereas growth in domestic consumption of air transport services was 4.01%. India exports 10.2% of services to Indonesia among all ASEAN economies, making it a significant trade partner. But in terms of value addition in Indonesian air transport services, France and South Korea top the list and India is unable to capitalise on the opportunities thrown open by the liberalisation policies of Indonesia. The air transport sector’s ability to bridge Indonesia to emerging countries and fast-growing cities can help drive economic growth of the connecting economy. According to data provided by Oxford Economics, there are 108 direct flight destinations among the ten fastest growing countries in the world, on the basis of GDP growth and 119 direct flight destinations among the 20 fastest growing countries. China is leading the league, by connecting maximum direct flights to Indonesia amongst the fastest growing economies followed by Vietnam and Philippines. Indian aviation missing out? According to the same source, there are 7 direct weekly flights among the ten fastest growing cities in the world as measured by GDP growth and over 5,500 direct weekly flights among the 100 fastest growing cities, but India is missing in capturing these business opportunities. India has an opportunity to invest and expand the business of air transport services in Indonesia. The air transport subsector has also been a driver of service sector growth. Albeit smaller than the combined communication sectors, its GDP contributions have doubled in the last decade. Successful deregulation has again been a key driving force (Basri & Hill, 2010). This argument juxtaposes the potential for Indian air transport service suppliers. An overriding step favouring deregulation will certainly generate revenues and employment in Indonesia, and thus it could be considered by the Indonesian government as a viable or doable proposal. The rapidly expanding demand for air transport, enhanced by the upcoming ASEAN Open Skies Policy, already exceeds the capacity of many Indonesian airports, requiring extensions and new airport developments. Since airports and airline operations are typically regarded as economically and financially viable, there is little demand for external support. Overall, India has relative strength in some of the air services, which can be extended to the Indonesian market. It also has an advantage in terms of pricing, which can be replicated in Indonesian market if domestic players like Air India, Indigo, Spice Jet and Jet Airways are allowed to operate either through

WTO Ministerial, New Delhi: Vanishing North-South divide? Not quite there yet
• India is hosting a WTO Ministerial meeting in New Delhi today to discuss and build consensus on key issues facing the multilateral forum. • One of the core discussion points will be the issue of Special & Differential Treatment (SDT) to developing countries, which the US has opposed at the WTO. • The US highlights how emerging markets have ramped up their share of global exports to over 50% over the past two decades. • However, considering parameters like per capita income, human development index, etc. countries like India have a strong ground to demand continuation of SDT status. Representatives of 22 developing and least developing countries including China, Brazil, South Africa, Bangladesh and the Caribbean are converging in New Delhi on May 13, 2019 for a 2-day WTO Ministerial Meeting to discuss and build consensus on a number of issues. The conference comes in the wake of a series of game-changing developments in global trade and growing differences at the WTO. It appears that the weakening multilateral consensus on trade is on the brink of a tipping point. US-China negotiations are on the brink of breaking down, with the Trump administration going ahead with its threat to raise tariffs on US$ 200 billion worth of Chinese imports from 10% to 25% last week. During the same week, US Secretary of Commerce Wilbur Ross visited India with a clear signal that the US was expecting greater market access. There are myriad challenges at the WTO, like plurilateral discussions on e-commerce rules, deadlock in the dispute settlement process and fisheries subsidies. Moreover, the ‘developing’ status of a few is under threat! The US has moved a proposal to end the Special and Differentiated Treatment (SDT) for India, China, South Africa and Indonesia, arguing that they have crossed that threshold. Axis of global trade is shifting Sure enough, emerging markets have garnered an increasing share of global trade in the past few years. A study by Bloomberg analyses the extent of this shift over the past two decades. Twenty years ago, around 62% of bilateral trade was between the rich countries – US, Europe and Canada. Since then, the value of trade between emerging countries has increased by over 10 times and share of bilateral trade between rich countries has dropped to 47%. Around 53% of bilateral trade now involves at least one emerging market, compared to 34.8% in 1992. The number of countries with majority emerging market trade has increased from 1 in 1992 to 64 in 2017. The report brings out some interesting sectoral trends as well. For instance, around 78% of agricultural exports from Brazil and Argentina are now headed to other emerging markets, while the figure was 50% in 1997. Similarly, over 55% of exports of metals and precious gems from South Africa go to emerging markets, while their share was 22% in 2007. The share of emerging markets in OPEC crude exports has increased to 45% from 11% in 1997. Emerging market’s share of global consumption has also risen sharply by around 50% over the past decade. On the economic front, the next decade clearly belongs to Asia, if you consider the economies projected to exhibit growth rates of over 7%. A slowing China won’t be part of that club, but India, Bangladesh, Vietnam, Myanmar and Philippines will meet that benchmark, according to a report by Standard Chartered Bank. These countries will be joined by the African nations of Ethiopia and Côte d’Ivoire on this list, which implies a doubling of GDP every decade. But divide goes beyond trade So the question arises whether the US is right in its argument that SDT status to developing countries like India should be discontinued. The special and differential treatment clause provides developing countries with certain provisions, which include longer time-period for implementation of Agreements and commitments, measures to improve trade opportunities and support to carry out WTO-related work like dispute handling, implementation of technical standards, etc. For instance, India was allowed manufacturing subsidies, which developed countries were not. But if the developing country reaches a certain share of global exports in a particular product, it is not permitted to give a subsidy on that product. Currently, WTO member nations who have proclaimed the status of a developing country can avail of these benefits. US believes that this self-declaration is mischievous and misleading, with exports of developing countries now reaching over half of world exports. It seeks a review of the status, while developing countries like India feel it should continue as they are in different stages of economic, financial and technological development. Moreover, they opine that per capita income indicators should hold precedence over share in global trade when it comes to developing country status. India’s per capita income at around US$ 1,979 stands way below Singapore (US$ 57,714.3), South Korea (US$ 29,742.8), United States (US$ 59,927.9) and China (US$ 8,827.0) according to the World Bank. A country like India may have witnessed a rise in per capita incomes, but it still ranks 130 on the Human Development Index (UNDP). India only shed the ignominious tag of being home to the largest population of poor people in the world in 2018, to be replaced by Nigeria. Moreover, since SDT is part of WTO rules, changes need to be negotiated by members. So it is critically important that developing countries defend their SDT status stiffly, both under the provisions of the WTO and their genuine concerns with respect to their economic status. It is also important to note that with bilateral trade between emerging markets on a rise, they are no longer as dependent on trade with First World nations as they were two decades ago. By taking a united stand on SDT, they can assert their bargaining power at the WTO even more strongly.

Product Profile: Food Emulsifiers
HS Codes: 210690, 382490, 330210, 292320 • The global food emulsifiers market is expected to grow at a CAGR of 5.5% over the period of 2019-2024. • Asia Pacific is projected to be the fastest growing market for food emulsifiers over the next five years. • Rising demand for healthy and organic food products is expected to drive growth in food emulsifiers globally and in India in the next few years. • India is a net exporter of food emulsifiers with the Netherlands as the major export market. The urge to meet safety standards and quality of food, transportation from farm to plate and storage are major challenges faced by the developed world. To cater to this demand, food emulsifiers are popularly utilised by manufacturers. Furthermore, rising population, burgeoning incomes and affordability of middle-class consumers are driving an increase in demand for food, and in turn, for emulsifiers. S.No Dominions Types 1. Various types of food emulsifiers Lecithin Monoglyceride, diglyceride & derivatives Sorbitan ester Polyglycerol ester 2. Usage of food emulsifiers in various food domains Dairy and frozen products, bakery, meat, poultry, and seafood, beverage, confectionery, oil and fat 3. Major global food players (consumers and suppliers) US, Canada, EU, China, Japan, India, Australia, Saudi Arabia, The value of the global food emulsifier market was estimated at US$ 3.46 billion in 2018 (as per Mordor Intelligence), and it is projected to grow a CAGR of 5.6% during the forecast period (2019-2024). There is an escalating demand for speciality food ingredients like emulsifiers in various applications, due to functional properties, such as aerating, protein strengthening and starch complexing. Additionally, with the surging demand for high transparency and quality control on the ingredients used in consumers’ food, the market for clean-label food ingredients is expected to drive the market for food additives, such as emulsifiers. Focus-Asia PacificThe value of the global food emulsifier market was estimated at US$ 3.46 billion in 2018 (as per Mordor Intelligence), and it is projected to grow a CAGR of 5.6% during the forecast period (2019-2024). There is an escalating demand for specialty food ingredients like emulsifiers in various applications, due to functional properties, such as aerating, protein strengthening and starch complexing. Additionally, with the surging demand for high transparency and quality control on the ingredients used in consumers’ food, the market for clean-label food ingredients is expected to drive the market for food additives, such as emulsifiers. The Asia Pacific food emulsifier market is expected to exhibit the highest growth rate, touching 7% (according to Business Wire) for the next five years. The robust growth is mainly due to upcoming new food consumption patterns in the region, owing to the surging income and rapid urbanization, especially in South Asian countries. Further growth can be attributed to the increasing urbanization in the region, resulting in the growing demand for food security and quality food. Food manufacturers are expected to use food emulsifiers due to their multi-functional properties. Increasing demand for salubrious and organic food items over junk foods is projected to provide an impetus to the market for food emulsifiers globally, and in India in the coming years. Colorants and emulsifiers garnered a share of 15.4%, in the India food additives market (APEDA). Rising penetration of ready-to-eat food and budding demand for low-calorie sweeteners in the country is projected to drive growth in the food additives sector in India for at least a decade. The major demand for emulsifiers in India comes from the beverage industry, followed by bakery & confectionery, dairy, meat, poultry and seafood industries. Some of the food emulsifiers approved and allowed by USFDA along with their usage are as follows: I. Acacia (gum arabic) – Frozen dessert/food dressings and flavorings II. Bakers Yeast Glycan – In frozen dessert analogs, sour cream analogs, cheese spread analogs, and in cheese-flavored and sour cream-flavored snack dips III. Ethoxylated mono- and diglycerides – Edible fat-water emulsions such as coffee creamer substitute, in cakes and mix IV. Salts of Fatty Acids – Cakes and desserts V. Gum ghatti – Non-alcoholic beverages VI. Polyglycerol esters of fatty acids – Food or as cloud inhibitors in veg & salad oils VII. Sodium stearoyl lactylate – Puddings, snack dips and cheese VIII. Sucrose fatty acid esters – Coffee, tea, beverages and seafood India is a net exporter of lecithin and other phosphoaminolipids, which are used as food emulsifiers, where our exports in 2018 stood at US$ 74.7 million and imports stood at US$ 31 million. India’s major export destination of this product is the Netherlands, as 35% of our exports are accounted for by this market. Global exports of lecithin and other phosphoaminolipids grew at a CAGR of 5.22%, surging from US$ 782.5 million in 2014 to US$ 933 million in 2018; signaling a continuous rise in the demand for food emulsifiers.

Does a US-South Asia trade agreement provide India an impetus?
• In 2018, South Asia’s exports to US dwindled by more than US$ 3 billion, whereas US imports from the rest of the world surged by more than US$ 205 billion. • CGE results suggest that South Asia is going to be the loser in a South Asia-US free trade agreement. As per the simulation result, South Asia will be losing around 1.8% of the GDP and out of this, India would be losing the maximum. • US is going to gain about 0.45% of its GDP, primarily from allocative efficiency. There will be welfare increase amongst rest of the world as well. • It is important that the modifications in policies and negotiations are more harmonized. For example, introduction of FSMA (Food Safety and Modernization Act) and its impact on South Asian exports will be crucial to analyse, as countries in South Asia are a combination of developing and LDC economies. In the backdrop of a persistent trade war between US and India since 2017, both sides seem to have lost optimal trade gains that were expected under normal conditions. It has been a long held view that India needs to sign a trade agreement with the US in order to benefit from the trade liberalization process. After all, India is a key trading partner of the US, which visualizes it as a growth centre in the South Asia region. But one can consider a wider perspective on the issue. India is an important economy in the South Asian region, which already has an established regional trade bloc (SAARC). So it should be more fruitful if this entire trade bloc could enter into a trade agreement with the US. In the current situation where the US has gone overtly protectionist, the barometer of trade relations with India has reasonably plunged. Negotiations are on at regular intervals to revive the trade and enhance future trade prospects. There is no denial of the fact that neither India nor South Asia can ignore US for long, hence it could be in their best possible interest to look for a mutual trade agreement between US and South Asia. After all, complementarities exist, which can benefit member countries in various ways, like slowly boosting global free trade by allowing member countries to intensify their level of competition, providing time to the domestic industry to adjust, and creating an arena to tackle difficult issues like agricultural subsidies and trade in services. It allows countries to phase and sequence their liberalization in a manner that can optimize the benefits and reduce tensions relating to long-term political and ethnic hostility among various member countries. Low intra-regional trade South Asia is one of the most politically volatile and economically and historically underdeveloped regions in the world. It is home to a variety of countries having different per capita incomes, macro-economic performance, economic vulnerability index and human development index. Two low-income countries (Afghanistan and Nepal), five lower-middle-income countries (India, Pakistan, Bangladesh, Bhutan and Sri Lanka) and one upper-middle-income country (Maldives)* occupy over one-fifth of the world’s population including half of this planet’s poor. SAARC is a weak trading bloc as combined GDP is low and HDI scores of most economies are low as well. This trading bloc has a major comparative advantage in agricultural commodities as opposed to value added technology products, making it less powerful in bargaining terms at a global platform. After the formation of the free trade agreement, overall trade with the rest of the world has burgeoned, but not much has been achieved within the bloc. The export specialisation pattern of the South Asian Free Trade Area (SAFTA) has not changed much, as the coefficient of Galtonian regression (one of the indicators to evaluate export patterns) is 0.6973. Results of partial regression suggest that SAFTA as a trading bloc did not expand trade within the trading bloc. One possible reason is that the absolute value of intra-trade is minimal. Hence, it is indispensable for South Asia to look aggressively beyond the SAARC region. US has been one of the vital trading partners of South Asia, as there exists continuity of the complementary trade basket. Current protectionist measures adopted by the US throw up uncertainty and show volatility as far as trade practices and prospects are concerned. Researchers are a little skeptical as to how the path of progress would unfold. In 2018, South Asia’s exports to US dwindled by more than US$ 3 billion, whereas US imports from rest of the world surged by more than US$ 205 billion. Keeping this volatility in mind, this article is trying to explore the possible outcomes by running several shocks using GTAP database and simulating various scenarios. Since India is already negotiating with US for several years, it would be useful to explore the gains/losses from a possible trade agreement. CGE results suggest that South Asia is going to lose with a South Asia-US free trade agreement. As per the simulation result, South Asia will be losing around 1.8% of the GDP and out of this India would be losing the maximum. There won’t be any loss in the technology parameter, but this loss will be experienced by allocative efficiency, not by inefficiency. US is going to gain about 0.45% of its GDP, with the major gain coming from allocative efficiency. There will be welfare increase amongst rest of the world as well. For non-agricultural products, India and South Asia would lose by US$ 5 billion and US$ 6.7 billion respectively in terms of welfare. On the other hand, US is gaining significantly. For agricultural products on the other hand, India is gaining through such a trade agreement, but other South Asian countries are losing, though marginally. As expected, US is gaining by a decent margin. According to the results, this trade agreement may go the NAFTA way to an extent. But negotiations can be strategised to minimise the losses and gain in areas like technology transfer, skill development and benefits of rules of origin for market