

• The US has decided against extending waivers on imports of Iranian oil after May 2, 2019. • Unless US changes this decision, India, China, Turkey, Japan and South Korea will now have to stop importing oil from Iran or face US sanctions. • Even though India has been hedging its exposure over the past few months, an immediate and complete replacement of oil imports from Iran will be challenging. • The scenario highlights the perils of India’s overdependence on oil imports once more, which can only get worse if not addressed in a timely manner. After walking out of the Iran nuclear deal last year, the US had announced a 180-day waiver to eight countries importing oil from Iran in November 2018, allowing them time to seek other sources of oil. Three countries have complied totally so far – Greece, Italy and Taiwan; leaving India, China, Turkey, Japan and South Korea. The US Secretary of State Mr Mike Pompeo has now announced that there will be no further extension of the waiver after the 180-day window closes on May 2. In a statement released on April 22, Mike affirmed, “Today we are announcing the United States will not issue any additional Significant Reduction Exceptions [SREs] to existing importers of Iranian oil… We will continue to apply maximum pressure on the Iranian regime until its leaders change their destructive behaviour, respect the rights of the Iranian people, and return to the negotiating table.” Furthermore, Mr Pompeo has cautioned all nations against any kind of trade relations with Iran, as the “risks are simply not going to be worth the benefits”. So unless they want to invite sanctions, these five countries will have to stop importing oil soon. While Japan and South Korea are not so highly dependent, China and India are the largest importers of Iranian oil. The announcement raised the price of global benchmark crude oil to a six-month high during intra-day trade on April 22. The US also sought to assure that Saudi Arabia, UAE and other members of the OPEC will make up for the shortfall caused by the end of the exemption period. US President Donald Trump tweeted: Saudi Arabia and others in OPEC will more than make up the Oil Flow difference in our now Full Sanctions on Iranian Oil. Iran is being given VERY BAD advice by @JohnKerry and people who helped him lead the U.S. into the very bad Iran Nuclear Deal. Big violation of Logan Act? — Donald J. Trump (@realDonaldTrump) April 22, 2019 US wants Iran to come back to the table and renegotiate the nuclear deal, but Iran isn’t budging to the pressure so far. Iran earns around US$ 50 billion from oil sales, which is around 40% of its government’s revenues. The planned sanctions aim to inflict severe damage on the Iranian economy and weaken its government. Alireza Tangsiri, head of Iran’s Revolutionary Guard Corps navy force, has threatened that Iran will close the Strait of Hormuz, which carries one-fifth of the world’s oil trade. Some countries have rightly pointed out the unfairness of such unilateral sanctions by US aimed at forcefully redefining their relations with Iran to serve its own interests. Turkey’s Foreign Minister Mevlut Cavusoglu, commented, “We don’t accept unilateral sanctions and impositions on how we will maintain ties with our neighbors.” China has also opposed unilateral sanctions, with Foreign Ministry spokesman Geng Shuang asserting, “China’s cooperation with Iran is open, transparent, reasonable and legitimate, and should be respected.” Iran’s oil exports have already come down from 2.5 million bpd in April 2018 to 1 million bpd in March 2019. Notably, US has increased its own production last year by 1.6 million bpd over 2017 and expects to increase it by a further 1.5 million bpd in 2019. So the US will naturally leverage the opportunity to bring its surplus supply to the international market. How India should cope India is also successively reducing its oil imports from Iran over the past few months. According to company reports, Indian Oil Corporation Ltd (IOCL), which is the largest refiner in India and largest buyer of Iranian oil has been leveraging alternate suppliers since 2018 to cushion itself from the impact of the sanctions. India’s petroleum ministry released the following statement on the announcement, “The Government of India has put in place a robust plan to ensure that there is adequate supply of crude oil to Indian oil refineries from May 2019 onwards. There will be additional supplies from other major oil producing countries from different parts of the world.” Last November, India used escrow accounts of five Iranian banks that were held by UCO Bank Ltd to deposit money for oil imports from Iran in rupees. This money would be used by Iran to meet the expenses of its diplomatic missions in India and also purchase essential products from India. The payment system was also relaxed to accommodate basmati rice exports, for which Iran is India’s largest export market. Exports of basmati rice to Iran were recorded at US$ 1.15 billion during April-January 2018-19. India imports around 80% of its oil requirements, and is therefore extremely vulnerable to volatile swings in global oil prices. India’s imports of crude oil (HS Code 2709) from Iran were valued at US$ 10.93 billion during April-January, 2018-19, growing by 21.7% over the entire fiscal year 2017-18. Iran accounted for a significant 11.25% of India’s imports by value during the period. Iran has given India more favourable credit terms of 60 days, lower prices and the benefit of rupee trade, making complete replacement of Iranian oil a difficult proposition for India. Venezuela is another major supplier to India with imports of oil valued at US$ 6.23 billion in April-January, 2018-19, but state-owned Petrуleos de Venezuela SA is also facing US sanctions. Moreover, the likely increase in international prices makes it even tougher. Every dollar increase in crude prices raises India’s oil import costs by Rs 10,700 crore per annum, according to estimates.
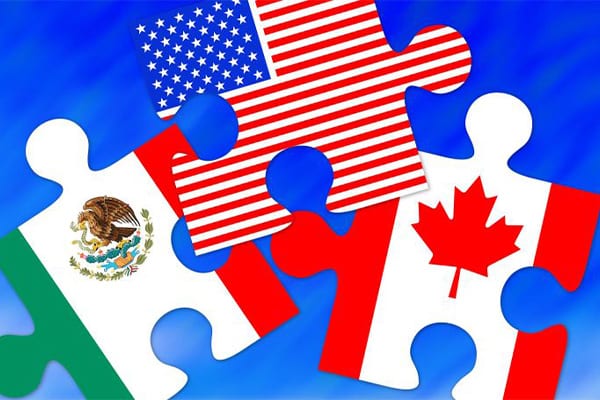
US-Mexico-Canada Agreement: Why the world should take notice
• The US International Trade Commission has estimated a small improvement to the US economy from the USMCA. • Signed between the heads of state for US, Canada and Mexico, the USMCA is yet to be ratified by the Congress. • The deal assumes significance for countries beyond the North American region, as it could serve as a template for future US negotiations in bilateral agreements as well as at the WTO. • Some of the clauses that would be of special interest to India include the new norms for the automotive industry, tariffs on steel & aluminium, rules for digital trade and intellectual property (IP) rights. The US International Trade Commission (ITC) has released its analysis of the US-Mexico-Canada Agreement (USMCA), the replacement for the NAFTA agreement proposed by US President Donald Trump. It estimates that the deal will improve the US economy by 0.35% when completely implemented, i.e. an increase in the country’s GDP by US$ 68.2 billion. The boost will come in particular from the potential growth in the automotive sector, where the agreement introduces new rules of origin. This will mandate auto-makers to source more parts from North America, thereby increasing production and employment. For the US specifically, it would imply creation of an additional 176,000 jobs. Its exports to Canada and Mexico would increase by 5.9% and 6.7% respectively. In its summary of the agreement, the ITC states, “The model estimates that the agreement would likely have a positive impact on all broad industry sectors within the US economy. Manufacturing would experience the largest percentage gains in output, exports, wages, and employment, while in absolute terms, services would experience the largest gains in output and employment.” However, the report cautions that the broader US economy will suffer in terms of higher costs of production, lower exports, reduced wages and employment. The IMF had recently submitted a contrasting report on the US MCA deal, stating that it will cause a decline in production of vehicles and parts in all three countries and take auto production and parts production outside the region. The USMCA was signed by the heads of state of US, Canada and Mexico in 2018. However, it still needs to get ratified by the US Congress. Given the manner in which US President Donald Trump seeks to redraw trade engagements with countries across the world, the USMCA also assumes significance for countries like India. The NAFTA preferential trade agreement covered around US$ 1.3 trillion of trade annually, making it the world’s largest. The new USMCA introduces several clauses on rules of origin, intellectual property, labour rights, environmental policies, government enterprises, exchange rate and digital trade. It also changes the rules of the game for sectors like automotive and steel in the region. It is also the first trade agreement that the US has successfully renegotiated, and in all likelihood, is the template with which it could approach subsequent agreements with other trading partners like India. The deal is in principle a vote for upholding the economic interests of the US over promoting free trade. More critical is the clause of manufacturing 75% of the components of cars and trucks in North America. If that is not met, the companies will attract additional tariff duties. Therefore, the deal compels leading players in the auto industry to revaluate their sourcing from low cost destinations like India, China and Vietnam. Supply chains serving Mexico would face a huge impact. The country is the second largest supplier of vehicles to the US and the fourth largest exporter of cars in the world. In a survey by LevaData of 100 leading auto executives, 63% of the executives believed that the deal is expected to raise production costs for manufacturers due to higher tariffs on raw materials and higher costs. This can have a ripple effect across supply chains. For instance, microelectronics contributed around 15% to a car’s selling price in the 1990s. Due to the evolution of technology and features like information and entertainment systems and advanced safety equipment, this now contributes nearly 40% of the cost of a car with an internal combustion engine. For an electric vehicle, this cost goes up to 75%. This will mean a short-term disruption, since China is the leading supplier of these components at present, and add a lot of uncertainty for manufacturers going forward. In addition, 70% of the aluminium and steel has to be from North America. The US is imposing duties on aluminium and steel products from its USMCA partners, so India may not have much room for optimism for negotiating a major concession on this matter either. In the pharma industry, Trump’s backing for Big Pharma comes out in no uncertain terms. Currently the US has a 12-year protection for drug companies producing biologics, implying that they have monopoly power in the market for that period. This duration is deemed extremely high; in comparison Mexico mandates five years of protection and Canada provides eight. But under the USMCA, all three economies have to give innovator companies a minimum protection of 10 years. Ironically, this has the unwanted impact of increasing drug prices for consumers as well, contradicting Trump’s avowed intentions of lowering drug prices. Data sovereignty is a highly sensitive issue in global trade at present. The USMCA has a provision for free flow of data among the three economies, which will boost services sectors including banking, airlines, online retailers and entertainment companies. The deal frees up digital trade among partner economies with zero tariffs. It may be noted that India has strongly opposed both these clauses at the WTO. A report from the US Trade Representatives Office concluded that the deal will benefit automotive, aluminium and steel sectors through a surge of US$ 600 million over the next five years. It will incentivise automotive part purchases worth US$ 23 billion for the period. It also has a labour clause, through which 40-45% of labour content of every manufacturing unit should be completed by workers earning

India’s export performance: Bucking the trend
• India registered exports of US$ 535.45 billion during 2018-19 with a growth of 7.97%, according to estimates from the Department of Commerce. • The performance is exceptional, especially considering the current turbulence in the global trade environment. • The growth in March was led by engineering, chemicals, pharma-ceuticals, petroleum and RMG of textiles. • The global environment is expected to remain hostile in the current fiscal, with the WTO projecting a deceleration in global trade growth. India’s total exports grew by 7.97% yoy to reach US$ 535.45 billion during FY 2018-19, according to data released by the Department of Commerce on April 15, 2019. In line with projections last month, merchandise exports grew by 9.06% yoy to reach an all-time high of US$ 331.02 billion during 2018-19, crossing the previous benchmark of US$ 314 billion achieved in 2013-14. Merchandise imports have also risen strongly by 9% yoy to reach US$ 507.44 billion, precipitating a rise in the merchandise trade deficit by 8.9% to US$ 176.42 billion. Services exports, on the other hand, are estimated to have grown by 6.3% during 2018-19 to touch US$ 204.43 billion with a trade surplus of US$ 80.57 billion. The growth comes amidst a difficult trade environment, especially with the rise in protectionist measures by a number of countries. The WTO’s World Trade Outlook Indicator released in February 2019 showed a reading of 96.3, indicating below-trend expansion in the first quarter. This is driven by strong declines in component indices – export orders (95.3), international air freight (96.8), automobile production and sales (92.5), electronic components (88.7) and agricultural raw materials (94.3). The decline is attributed to trade tensions, political risks and financial volatility. One of the major reasons for this resilience in India’s exports is better awareness and matching of quality and standards by the exporters. As a result, the acceptability of the consignments has been better. In addition, exports have remained strong even as the rupee appreciated against the US dollar over the past few months. This shows a strong demand for Indian exports. Improvement in the liquidity situation also helped boost the numbers, as did low inflation, which ensured that pre-shipment credit was not as expensive. On a long-term trend basis, there is a discernible shift in India’s exports towards higher value added manufacturing and technology-driven items. RBI data indicates that between 2011-12 and 2018-19, there is a significant rise in exports of chemicals and products as well as engineering and related goods. This has helped keep Indian exports relatively resilient to changes in the global trade environment. Leading the growth trend The major sectors that showed positive growth in March 2019 were chemicals (16.98%), engineering goods (16.3%), RMG of all textiles (15.13%), drugs & pharmaceuticals (13.59%) and petroleum products (6.55%). Most of the categories comprise intermediate products, implying that India provided raw materials/inputs for final production in overseas markets. The engineering sector has been a standout performer, recording exports of US$ 83 billion during 2018-19. India has set an aspirational target of US$ 200 billion for engineering exports by 2025. Within the engineering sector, one can notice a strong positive performance in most panels over the year. Exports of iron & steel (along with products of iron & steel) have declined by 5.85% yoy to reach US$ 15.4 billion, according to latest available data for April-February, 2018-19. Non-ferrous metals and products (copper, aluminium, zinc, lead, etc) have witnessed an even sharper decline by 15.6% yoy to reach US$ 7.7 billion. The major reasons for the decline in iron & steel exports during the period are – relatively better domestic price realisation, aggressive pricing strategies leveraged by China and protectionist policies adopted by the US and EU. Copper production dropped significantly during H1, 2018-19, primarily due to the shutdown of Sterlite Copper’s smelter in Tuticorin, which caters to 40% of India’s copper smelting capacity. However, the trend in value added products is much more positive. Industrial machinery & parts exports grew by 15.1% to reach US$ 13.04 billion. A similar trend is visible in electrical machinery, which grew by 28.7% to reach US$ 7.64 billion. Other major panels that saw strong growth during the period include auto components/parts (11.84%); ships, boats and floating products and parts (35.7%), railway transport (37.1%) and other construction machinery (17%). Exports to the US were recorded at US$ 10.8 billion during April-February, 2018-19, growing by 16.9%. Nepal (20%) and Bangladesh (16.75%) also witnessed strong positive growth, while UAE (1.7%) and Germany (3%) saw relatively modest increase. The strongest growth was seen in Nigeria (52.6%), Thailand (31.6%), Sri Lanka (29.35%) and Japan (22.29%), indicating that the engineering sector has managed to significantly diversify the export basket over the years. In the chemical sector, China has invited increasing scrutiny from its trade partners like the EU on environment-related concerns in the past few months. This has been a positive for India, which is now seen as a stable source of high quality chemical products. Exports of organic chemicals to Europe were recorded at US$ 3.93 billion during April-January, 2018-19, compared to US$ 4.2 billion during the entire year 2017-18. Inorganic chemicals export to the region stood at US$ 277 million during April-January, 2018-19, compared to US$ 252.11 million for FY 2017-18. Growth in RMG exports over the past few months can be attributed to the base effect, as the sector was badly impacted by the reduction in export incentives under the GST regime last year. However, the sector is going through its fourth successive year of weak growth/decline. India’s RMG exports have declined by 3.4% yoy in 2018-19 to reach US$ 16.15 billion. Going forward, the environment remains challenging. A major setback for the RMG sector this year has been fall in demand from traditional markets like Middle East, France, Sri Lanka and Sudan. Other issues include the challenge to Indian export subsidies under WTO, emerging competitors like Bangladesh and Vietnam, domination of unorganised players at the low end of the value chain and lack of trade agreements

Rejuvenating the India coffee story
• Global coffee production has exceeded consumption for the second year in a row, precipitating a decline in coffee prices. • The dual impact of declining coffee prices and rising labour costs is pushing many coffee growers into deep debts. • The World Coffee Producers Forum has devised a strategic roadmap to focus on major coffee consuming countries across the world. • India is taking the lead in this regard by devising a five-year coffee consumption campaign to boost sales in the domestic market. International coffee growers are in dire straits at present due to the dual impact of declining coffee prices and increasing labour costs. The International Coffee Organisation estimates that around 25 million farmers grow coffee in 60 countries, and over 90% of these are small growers and are currently compelled to sell their produce well below the cost of production. This has pushed several of them into deep debts, and some have even abandoned their farms to migrate to the cities. According to ICO statistics, the world consumes 1.5 billion cups of coffee every day, with the average price of a cup at US$ 3.1 in the US, US$ 4.60 in Shanghai, US$ 6.24 in Copenhagen and US$ 3-4 in Bangalore and New Delhi. But growers do not get even 5% of this value. Moreover during 2018-19, coffee production is expected to exceed consumption for the second year in a row, with the differential at 3.06 million bags, compared to 4.16 million bags in 2017-18. Production growth was the highest in South America, with output increasing by 4.4% yoy to 80.42 million bags in 2017-18. On the other hand, consumption growth was the strongest in Asia & Oceania (4.4%). The ICO composite declined from US 112.99 cents/lb in March 2018 to US 97.5 cents/lb in March 2019. India is a major stakeholder on this front, as it is currently home to 300,000 coffee farmers. In 2018, India’s coffee exports showed a positive increase of 2.2% in unit value, which stood at Rs 164,733 per tonne (source: Coffee Board). However, this comes on the back of a decline in exports by 7.6% yoy to reach 350,195 tonnes. Coffee production is getting increasingly unviable in India due to shortage of labour, rising labour costs as well as vagaries of climate change. In order to address the situation, the World Coffee Producers Forum has devised a strategic roadmap to focus on the coffee consuming countries in the world. India plans to launch a five-year coffee consumption campaign in collaboration with major coffee brands like Nestle and Starbucks, along with the Government of India and other stakeholders. A special entity will be created to execute the campaign, which will be mostly funded by international roasters, and kickstart by mid-2020. The target audience for this campaign will be 450 million people, comprising mainly of school and college students. Mr Anil Kumar Bhandari, president of India Coffee Trust and chairman of the Private Sector Consultative Board of ICO, comments, “It is like catching them young, before students get involved with colas, carbonated sugar drinks or liquors. We have to create a generational change and build a coffee culture. The campaign will be managed in consultation with parents, teachers and school/college managements. We will also rope in sugar companies, dairy brands into it.” The campaign will have the active involvement of Carlos Brando, the brain behind Brazil’s popular coffee campaign that successfully pushed coffee exports in the country in 1990. The plan includes importing excess coffees from Brazil, Vietnam and Columbia, subject to the Government of India waiving the import duty of 105% on coffee. India has been viewed as a highly lucrative market for coffee players, prompting an aggressive growth push from the likes of Tata Starbucks, Nestle, Unilever and Café Coffee Day. However, per capita coffee consumption in India is still stagnant at 100 gms, compared to US (4 kg) and Finland (9 kg). Consumption is estimated to have grown at a low CAGR of 2.3% since 2010 to reach 110,000 tonnes in 2018. Coffee drinking remains concentrated in the southern markets of Tamil Nadu and Karnataka, which account for 85% of total consumption. Apparently, the youth in the non-traditional markets does love to visit cafes, but does not seem to have a penchant for consuming coffee back home. In such a scenario, if the campaign to boost consumption is successful, it will be beneficial for Indian coffee producers as well, since they will have the benefit of a lucrative growth market on their home turf.

Product Profile: Pasta
HS Code: 1902 • The global market for pasta was valued at US$ 12 billion in 2018, and is expected to reach US$ 16.5 billion by 2023. • Italy is the largest exporter of pasta in the world, while US is the largest importer of the product. • Demand for pasta is fuelled by an increasing preference for healthy as well as ready-to-eat/easy-to-cook products amid chaotic lifestyles. • However, the rising popularity of low-carbohydrate diets could negatively impact growth. Pasta is an Italian dish which is common across the world owing to its expediency and health benefits. It can be prepared using an eclectic array of raw materials such as durum wheat, semolina, wheat flour, etc. It is available in various forms and flavours, which vary depending upon the tastes and preferences of a region. In recent years, the demand for pasta has been largely influenced by the young population, which opts for packaged, easy-to-prepare & ready- to-eat food products. The global market for pasta reached a value of more than US$ 12 billion in 2018, growing at a CAGR of 4.8% during 2011-2018. According to TPCI’s analysis, the market is further expected to reach a value of nearly US$ 16.5 billion by 2023. Top 10 exporters of pasta, in US$ million Exporters Value exported in 2018 (US$ million) World 9,546.865 Italy 2,859.868 China 923.43 South Korea 556.001 Turkey 552.51 Thailand 501.12 Belgium 341.634 United States of America 336.468 Germany 283.049 Indonesia 258.637 Netherlands 239.875 Top 10 importers of pasta, in US$ million Importers Value imported in 2018 (US$ million) World 9,218.768 United States of America 988.251 Germany 808.1 France 710.635 United Kingdom 561.894 Canada 377.487 Netherlands 358.377 Japan 322.814 Hong Kong, China 312.341 China 248.194 Belgium 245.672 Italy is the leading exporter of pasta in the world, with aggregate export value of US$ 2.86 billion in 2018. It is followed by China (US$ 923.43 million) and South Korea (US$ 556 million). The US is the world’s largest importer of pasta, with aggregate imports of US$ 988.25 million in 2018, followed by Germany (US$ 808.1 million) and France (US$ 710.63 million). Exports of pasta from India surged at a CAGR of 11% during 2014 to 2018, and were valued at around US$ 26 million. The key nations that import India’s pasta or spaghetti are: Bangladesh, USA, Russia, Vietnam, Bhutan, South Africa, Sri Lanka, Saudi Arabia, and Nepal. On the other hand, India’s imports of pasta were recorded at US$ 16.46 million in 2018. Major sources of import for India in this product category are Italy, Turkey, Singapore, South Korea and Nepal. Global pasta market trends The global pasta market is influenced by a number of favourable factors. On account of chaotic lifestyles, consumers are moving towards easy-to-make food products. Since it happens to be an expedient and healthy product, the demand for pasta, particularly for products such as vermicelli, fusilli and macaroni, has been on the rise. Pasta is known to truncate the risk of high blood pressure and cardiovascular diseases as it has low-sodium and cholesterol content. Its high nutritional value and rich carbohydrate content have led to an escalation in the consumption of pasta among health-conscious consumers. Apart from this, western influences have led to a shift in the eating habits of the consumers, particularly in the developing nations, which offers optimum opportunities for the global pasta market to flourish. Manufacturers are also offering a wide variety of pasta products, which cater to the changing tastes and preferences of the consumers. Additionally, various product innovations such as introduction of gluten-free, vegan and organic pasta have managed to attract a larger consumer-base. However, the rising popularity of low-carbohydrate diets can pose a threat to the market growth.
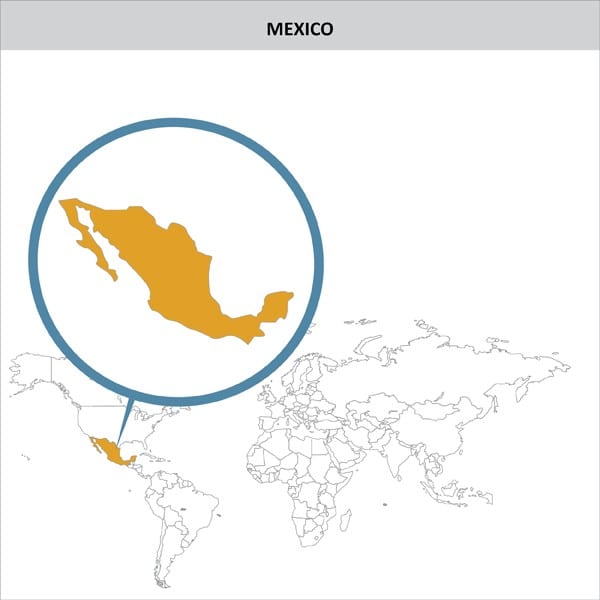
Country Profile – Mexico
• Mexico is among the fifteen largest economies of the world and is hugely dependent on US for its exports. • After signing the NAFTA agreement, Mexico has tried to diversify its trade to other countries/regions including Japan, Colombia, EU, Chile, Israel and Peru. • Indo-Mexican trade has grown by 240% over the past decade to reach a record US$ 10 billion in 2018. • However, tariff barriers are a significant constraint for bilateral trade, necessitating a trade agreement between the two countries. Mexico is among the world’s 15 largest economies and is the second largest economy in Latin America. The country is highly dependent on the United States, its largest trading partner and destination of 80% of its exports. GDP growth in 2018 was moderate at 2.2%; small improvements of around 2.5% and 2.7% are expected in 2019 and 2020 respectively, according to IMF estimates. Mexico’s economy is diversified, including hi-tech industries, oil production, mineral exploration and manufacturing. Agriculture accounts for 3.42% of Mexico’s GDP and employs over 12.97% of the country’s active population (World Bank). However, credit scarcity continues to harm this sector. Mexico ranks among the world’s largest producers of coffee, sugar, corn, oranges, avocados and limes. Cattle farming and fishing are also important activities in the food industry. Mexico is also the world’s fifth largest producer of beer and its second largest exporter. After becoming a part of the NAFTA trade agreement, Mexico tried to diversify its trade to other regions and signed some FTAs and PTAs with several economies like Japan, Colombia, EU, Chile, Israel, Peru etc. Many economists and policy makers argue that the Mexican economy had to suffer due to US dominance in the eclectic framework. One of the important repercussions, which the Mexican economy had to face was in terms of losses in jobs. Due to the amplified ease with which Mexico can import food products from the United States, Mexican farmers faced major job losses. This also hampered Mexico’s natural environment, as NAFTA compelled the country’s farmers to be more cost effective, provoking them to use more fertilisers and other chemicals. India-Mexico trade relations India and Mexico benefit from strong historical parallels and similar geo-climatic conditions, biodiversity, physiognomy, people, country and family values. Mexico was incidentally the first Latin American country to recognise India after independence in 1947. Indo-Mexican hybrid varieties played a critical role in India’s green revolution in the 1960s. There has been a sharp upswing in trade between India and Mexico in the recent past. Bilateral trade grew by 240% over the past decade, and by 58% since 2016. It reached a record US$ 10 billion in 2018 as compared to US$ 2.98 billion in 2008. After a visit by Indian PM Mr Narendra Modi in 2016, the two countries decided to upgrade their bilateral relations to the level of strategic partnership. Mexico has now overtaken Brazil as India’s most important trading partner in the Latin American region. For 2018, the trade balance shifted in India’s favour, with exports at US$ 5.23 billion, growing by 4.2% yoy. Top product categories exported by India to Mexico include motor vehicles for the transport of persons, aluminum, copper, parts & accessories of vehicles; tubes, pipes & hollow profiles; fittings, iron, steel; motorcycles & cycles; organic, inorganic, heterocycl. compounds, neuclic acids, articles of apparel, of textile fabrics, nes. India is the second largest supplier of motorcars and other transport vehicles to Mexico after the US. Some of the major brands include Volkswagen India’s ‘Vento’, General Motors ‘Beat’, Ford’s ‘Figo’ and ‘Figo Aspire’ and Maruti Suzuki ‘Ciaz’. Top product categories imported by India from Mexico apart from petroleum and crude oils include telecommunication equipment, nes & parts, nes; automatic data processing machines, nes; steam turbines & other vapour turbin., parts, nes; parts & accessories of vehicles; organic-inorganic, heterocycl. compounds, nucl. acids; flat-rolled products of alloy steel, internal combustion piston engines, parts, n.e.s. and fixed vegetable fats & oils, crude, refined, fraction. Non-oil imports increased by 65% yoy in 2018. Overall the tariff rates are minimal for those commodities, which Mexico imports like electrical and electronic equipment, machinery and instruments, automobiles etc. Still there is a difference in the tariff rates applied to those economies with which they have trade agreements and with India. For instance, the tariff applied on motor cars and other motor vehicles principally designed for the transport of persons is 35% for Indian exports and nil for the US. The story is similar for motorcycles, including mopeds where Mexico applies a tariff of 15%. Considering Mexico’s growing importance to India, the two sides need to enter into a mutually beneficial trade agreement at the earliest.

RCEP negotiations: Is India destined for a losing proposition?
• Post the signing of the Regional Comprehensive Economic Partnership (RCEP), India’s exports to the region are likely to increase by US$ 5.5 billion annually, with the highest increase to China followed by Vietnam and Thailand. • India’s imports may increase by a whopping US$ 29 billion annually post-RCEP, implying a revenue loss of as much as 1.3% of GDP. • At the product level, export is likely to be highest in ores, slag and ash (HS26) followed by cotton (HS52), raw hides (HS41), cereals (HS10) and vehicles (HS87). • Despite the overwhelming odds, there lies a vast potential, provided India is able to negotiate a proper trade policy and provisions in the coming days. The changing landscape of international trade negotiations has implied an emphasis towards mega trade agreements. This approach is seen as a stepping stone towards a global free market economy, with many countries expecting it to stimulate economic growth, boost trade and investment, reduce poverty and increase employment. Keeping this in mind, a number of countries have completed bilateral free trade and investment agreements in the Asia Pacific region and more deals are presently underway. India has also signed, and is in the process of signing, many bilateral and regional Free Trade Agreements (FTAs). These regional FTAs include the Bay of Bengal Initiative for Multi-Sectoral Technical and Economic Cooperation (BIMSTEC); South Asian FTA (SAFTA), Indo-ASEAN FTA, RCEP, etc. RCEP is all set to be signed in the near future, which raises many questions with regard to its impact on countries like India, particularly the highly vulnerable agricultural sector. The agreement involves ten members of ASEAN and its six FTA partners – India, Australia, China, Japan, New Zealand and South Korea, which together account for over 34% of global GDP, and about 40% of global trade in goods and services. For India, issues of tariff rate are as important as other areas under negotiation, mainly because India does not have trade agreements with all countries involved in RCEP. For instance, India does not have an FTA with China and the negotiations with Australia and New Zealand have still not been concluded. Similarly, tariffs on many product lines are yet to be eliminated for the countries where India’s agreements are already in effect. The post-RCEP regime is likely to worsen India’s trade balance with the RCEP block. However, it is not clear where India can benefit from the RCEP in a way that can compensate the losses from other chapters of the RCEP. In all likelihood, a more aggressive push for a greater market access in services will benefit India and reduce the gap in the trade loss. India’s imports may increase by a whopping US$ 29 billion annually during the post-RCEP period (WITS Simulator), implying a revenue loss by as much as 1.3% of GDP. The increase in imports will be the highest from China followed by South Korea and Japan. On the other hand, India’s increase in imports will be the lowest from Cambodia, preceded by Laos and Brunei. At the commodity level, India’s import is likely to experience the highest increase in machinery, electrical and mechanical equipment (HS84 and HS85) followed by ships, boats and floating structures (HS89), animal or vegetable fats and oils (HS15) and wood and articles of wood (HS44) from these RCEP participants. India’s exports are likely to increase by US$ 5.5 billion annually, with the highest increase in exports to China followed by Vietnam and Thailand. There will be no net increase in export of goods post-RCEP, as a relatively low growth in exports will widen the trade deficit, which was estimated at over US$ 78 billion annually (in 2014). At the product level, export is likely to be highest in ores, slag and ash (HS26) followed by cotton (HS52), raw hides (HS41) cereals (HS10) and vehicles (HS87). These top 5 products would account for more than half of India’s rise in exports to the RCEP bloc in the post-tariff elimination period. RCEP can act as a catalyst in heralding major trade-related reforms unheard of in the post-WTO regime. Experts say that RCEP will give Indian exporters a window as well as a cushion to be a part of global value chains. It is hoped that implementation of RCEP will change the fate of manufacturing in India and turn around the overall economy. Regarding India’s gain from RCEP, there will be clear answers only after the deal takes the final shape. Extending the argument further, growing economic partnerships of RCEP members with the rest of the world could increase trade diversion, thereby hampering India’s export growth to these countries. On the other hand, given the increased trade volume among the partner countries, there lies a vast potential, provided India is able to negotiate a proper trade policy and provisions in the coming days.

Complexities of SPS under WTO: An Outlook
• Non-tariff measures represent a key issue in the Agreement on the Application of Sanitary and Phytosanitary Measures (SPS Agreement), specifically in Article 7 and Annex B (WTO Committee on Sanitary and Phytosanitary Measures. 2018) • SPS measures raise time and costs associated with trade; they also obstruct the development of efficient and safe supply chains, and have a negative impact in business participation, especially affecting micro, small and medium enterprises (MSMEs) in regional and global value chains. • It is necessary to point out that the main stakeholders who are interested in accessing better SPS notifications, are the ones involved in trading with the country that is imposing that measure. • In a world that is currently facing outbreaks of protectionism across borders, transparency is a must to address these trends. The WTO agreements covers a wide range of issues related to trade, such as agriculture, textiles, services, food sanitation regulations and others; however, there are a number of simple and key principles that are included in the majority of agreements. Those principles are related to making the trade competitive, non-discriminatory and transparent (World Trade Organization [WTO], 2018). In this regard, one way for the multilateral system to improve predictability and stability is through transparency provisions. With those binding commitments, WTO members are expected to manage trade rules as clear and public as possible (WTO, 2018). Given the importance that the WTO has been giving to transparency provisions, non-tariff measures represented a key issue in the Agreement on the Application of Sanitary and Phytosanitary Measures (SPS Agreement), specifically in its Article 7 and Annex B (WTO Committee on Sanitary and Phytosanitary Measures. 2018). This agreement entered into force after the Uruguay Round of the General Agreement on Tariffs and Trade (GATT) in 1998. Since then, transparency has been an important issue in the multilateral trading system in terms of allowing any person to be aware if a trade measure has been implemented in any country. Considering the huge quantum of SPS measures presented by WTO member economies, the process of notifying the implemented measures hasn’t been managed in the most efficient way. Given this situation, one can conclude that quantity does not always represent quality. One of the many possible reasons for this to happen, is that there are still many – both political and economic interests – in not using the SPS notifications in a proper manner. This lack of will to notify the measures implemented correctly might fall under the classification of a Non-Trade Barriers (NTBs), which are still prominent across the world and increasing at an alarming rate. NTBs create dissatisfaction in businesses, given that they raise the time and costs associated with trade. They also obstruct the development of efficient & safe supply chains, and have a negative impact in businesses’ participation, especially affecting micro, small and medium enterprises (MSMEs) in regional and global value chains. As of today, it is not possible to quantify the real cost of NTBs with certainty, given that in most cases they are unclear and unpredictable. Ambiguity, inconsistency, and discriminatory behaviour in both, information and enforcement of SPS regulations are common problems highlighted by stakeholders from the business community. According to APEC Business Advisory Council (ABAC), 80% of business respondents consider regulations to be difficult, complex and opaque to understand and implement. From this, we can infer that for businesses, SPS notifications and measures could be labelled as NTBs, which implies that the outcome of SPS Agreements is the very opposite of its main objective. It is necessary to point out that the main stakeholders that are interested in accessing better SPS notifications, are the ones that are involved in trading with the country, which is imposing the measure. Also, by comparing the quality and completeness of the notifications between India and its main trade partners, it would be possible to determine if the items in which India shows a lack of quality and completeness, are also reflected in the notifications of other countries. Also, it might be necessary to include the perspective of the private sector, given that they are one of the main users, together with government officials, of the SPS notifications. It is essential to determine their main difficulties and/or challenges in order to propose possible solutions. It might also be necessary to identify other sources that the private sector uses to obtain the information that might be unclear in the SPS notification. In a world that is currently facing some outbreaks of protectionism, transparency is a must. In that sense, the correct use and implementation of the SPS Agreement and SPS notifications would allow countries to facilitate trade for stakeholders. At the end, trade facilitation will not only benefit exporters or importers; it would also benefit the society at large.

India’s apparel exports: Getting back to the drawing board
• The Indian apparel sector could continue facing tough times in the coming months, after four successive years of weak performance. • During April-February, 2018-19 apparel exports have witnessed a decline by 5.3% yoy, led by a sharp drop in exports to UAE. • Indian exporters face increasing competition from Bangladesh and Vietnam, which benefit from lower labour costs. Besides this, the case against India’s export subsidies at the WTO is expected to impact the textile sector. • It is urgent for India to expeditiously conclude trade agreements with major importing nations, apart from enabling exporters to upgrade on technology and move up the value chain. Apparel exporters are headed for difficult times ahead, due to a decline in demand from major markets. Although exports were showing promise in the beginning of the year, there is now a decline in both volume and value terms, according to a report by Drip Capital, which analyses macro trends and proprietary data of the top 100 apparel exporters which posted business of US$ 32 billion for the year till date. During April-February 2018-19, exports of readymade garments from Indian were valued at US$ 14.42 billion, a decline of 5.3% yoy. Fall in demand from the UAE has proved to be a major setback, since it is a major market for Indian apparel. A number of manufacturing units have now been set up in free market zones in UAE, leading to increase in raw material imports over finished goods. During April-January 2018-19, exports of apparel and clothing to UAE (chapters 61 and 62) reached US$ 1.6 billion, a sharp drop considering the corresponding figure of US$ 2.82 billion for FY 2017-18. This drop has countered the impact of the increase in exports to the US and EU. Exporters are also focusing more on markets witnessing strong growth like the US, UK, Chile, Israel and Japan to counter the decline in markets like France, Sri Lanka, Middle East and Sudan. Persistent strain Last year, an ICRA report affirmed that 2018-19 will continue to be the fourth consecutive year of weak growth for the Indian apparel sector, with a de-growth of 4-5%, following a similar de-growth of 4% in 2017-18; and low growth rates of 1% and 3% in FY 2015-16 and FY 2016-17 respectively. This is despite a revival in the global apparel trade, which grew by 4-5% yoy during the first half of calendar year 2018. A major cause of this has been the growth in imports by EU, which accounts for two-fifth of international apparel trade. The turbulence was also linked to the transition to GST, changing positions on export subsidies and rupee appreciation, which affected the industry’s standing in a highly competitive global market. While the GST issue is getting sorted out, a new challenge confronts Indian exports, which has major ramifications for the textile sector. The US filed a case against India at the WTO, alleging that India’s subsidies were harming US companies. Its complaint earmarked five schemes, including Merchandise Exports from India Scheme (MEIS) and Export Promotion Capital Goods Scheme (EPCG). The US argues that since India has recorded per capita gross national income (GNI) > US$ 1,000 for three consecutive years, it is no longer eligible to provide these subsidies. The US, which is India’s top export market, recorded imports of US$ 3.3 billion during April-January, 2018-19. In comparison, its imports from India stood at US$ 3.86 billion in 2017-18. Bangladesh and Vietnam are emerging as important nations for apparel exports due to their low labour costs, and are aggressively capturing the emerging opportunities due to China’s declining share in the international market. Even India’s imports are increasing from Bangladesh and Vietnam, due to which the government increased import duties on over 330 textile items last year. Bangladesh fully exempts customs duty, due to which Chinese fabric is coming duty free to India via Bangladesh in the form of garments. Apparel imports from Bangladesh have risen from US$ 140 million in 2016-17 to US$ 201 million in 2017-18. Missing out on critical engagements One major area that is impacting India’s apparel exports is the lack of trade agreements. Due to the slow progress of the Doha round, a number of trade agreements have been signed leading to zero or preferential tariff arrangements between member countries. India does not have any FTAs with major apparel import destinations like EU, US and UAE, which severely impacts its competitiveness. For instance, in a category like T-shirts and singlets, which accounts for 16% of India’s apparel exports, the US imposes a tariff rate of 32%. For silk shawls and scarves, the US imposes 11.3% on India, while the Republic of Korea faces zero tariffs due to an FTA. This could get worse, as the US is now resorting to a wide range of protectionist measures. India has a Comprehensive Economic Partnership Agreement with Japan, but the latter is not a major export destination for apparels. Moreover, it is alarming that despite the agreement in August 2011, India’s share in Japanese apparel exports increased initially, but later declined and are now stagnant. Meanwhile, India’s market share of Japanese apparel imports continues to languish at 0.09%, compared to China (6.46%), Vietnam (1.17%) and Bangladesh (0.34%). India is currently negotiating the Regional Comprehensive Economic Partnership (RCEP) with ASEAN members, Australia, China, India, Japan, Republic of Korea, and New Zealand, which could lead to zero tariffs between member countries. However, this may also lead to a sharp rise in imports from nations like China, Vietnam and Republic of Korea, which currently face a Most Favoured Nation (MFN) tariff of 25% in India. Vietnam is gaining ground in the US, and is expected to do even better if the Comprehensive and Progressive Agreement for Trans-Pacific Partnership (CP-TPP) and the EU-Vietnam Free Trade Agreement are successfully concluded. Bangladesh has similarly leveraged GSP to increase its market share in EU from 7% in 2001 to 20% presently, even as India stays at 6-7%. These developments are indeed worrying, considering

Indian economy – Silver lining amidst dark clouds?
• India’s economy is expected to witness a slight pick up in growth in the current fiscal (2019-20), according to projections by the RBI. • Considering the downward pressure on growth, RBI has cut key interest rates for the second time in a row by 25 basis points. • Prospects of improving consumption growth and revival in investment could help propel the economy in the coming months. • While exports have remained resilient this year, continuing slowdown in global economies coupled with trade tensions could pose a downside risk in the current fiscal. India’s GDP growth slowed down to 7% in FY 2018-19, as per preliminary official estimates, compared to 7.2% in FY 2016-17. Agriculture grew at 2.7%, its lowest rate in three years and the services sector clocked a growth of 7.4%, its lowest in 7 years. But growth in industry has been strong at 7.7% led by manufacturing (8.1%) and construction (8.9%), even as mining grew at a much lower 1.2%. Asia Development Bank has projected a slight pick-up in growth to 7.2% in FY 2019 and rise to 7.3% in FY 2020. RBI has reduced India’s growth projection for 2019-20 from 7.4% to 7.2% as it cut the key interest rate by 25 basis points to 6% in its latest review. According to RBI estimates, if global growth drops 50 bps below the baseline, domestic GDP growth and inflation are expected to be 15-20 bps and 10 bps below the baseline respectively. RBI commented on the current challenges facing the global economy, “Further escalation of trade tensions and protectionist trends; increased volatility in global financial conditions over the uncertainty of the stance of monetary policy in the US and other advanced economies; uncertainty surrounding Brexit; a sharper slowdown in the Chinese economy and deviations of the south-west monsoon from the baseline assumption of a normal monsoon may pose downside risks to the baseline growth path.” With inflation estimated to stay below 4%, RBI seems to have decisively shifted its focus to sustaining the growth momentum, given the concerns on the global front. In this analysis, we take a look at how the current fiscal could pan out for the Indian economy on three critical fronts – consumption, investments and external trade. Ready to shop again? The liquidity crunch in the NBFC space that ensued after the IL&FS imbroglio continues to cast its shadow over India’s moderating consumption growth story, evident from the slowdown across sectors like automobiles and consumer goods. The government’s initiatives towards income support to farmers (particularly through the recently announced PM Kisan Samman Nidhi Yojana) and increase in the procurement prices for food grains are expected to boost rural consumption in the coming year. Even the urban consumption story could get better owing to cuts in interest rates, low food prices and declining prices of fuel. Notably, the RBI’s index of consumer confidence for the quarter ending March 2019 found consumers to be positive on the current economic situation for the first time in two years, and ‘the future expectations index reaching an all-time high. Expectations of inflation over the next year also dropped by 40 basis points as compared to December 2018. However, there will be a time lag before the effects of the rate cuts are felt, depending on how the banks pass them on to customers. Banks were unable to do so in the previous quarter. As bank credit grew by 14-15%, deposit growth was lower at 10%. This led to growth in credit to deposit rate of banks to a high-risk 78, making it tough for them to cut rates. Cleaning up for a new cycle Bank credit growth accelerated from 7% in FY 2017 to 11.9% in FY 2018. There are signs of positive outcomes on initiatives taken to address the bank NPA problem through measures like the review of stressed assets, introduction of the Insolvency & Bankruptcy Code, 2016 and recapitalization of a few selected banks. Share of non-performing loans dropped from 11.5% in March 2018 to 10.8% in September 2018, declining for the first time since 2016. Rating agency ICRA projects that fresh bank NPAs could moderate to 1.9-2.4% in FY’20 as compared to 3.7% in FY’19. It also expects 14 public sector banks to turn profitable in FY’20. Improved balance sheets for both corporates and banks should aid a revival of the private investment cycle. RBI’s industrial outlook survey for the quarter ending December 2018 showed business expectations at a 4-year high. Similarly, the share of respondents who anticipated an improvement in capacity utilization in the coming months was at a 6-year peak. Improvement in consumer demand could be positive for manufacturing. However, growth in investment remains sluggish. The Nikkei India Manufacturing Purchasing Manager’s Index dropped to 52.6 in March from a 14-month high of 54.3 in February 2019. Companies expect capacity expansion, marketing initiatives and favourable government policies to promote growth in production after the elections. Sustaining growth amid global headwinds The growth in imports slowed down to 9.8% during FY 2018. Oil imports grew by over 32% but there was a slowdown in capital goods and decline in gold imports. Exports grew by 8.9% especially owing to refined petroleum exports. Comparatively, non-oil exports grew by just 6%, despite strong growth in electronics, chemicals, pharmaceuticals, machinery and textiles. Services surplus grew by just 3% despite revival in software exports. Shri Suresh Prabhu, Hon’ble Minister for Commerce & Industry, Government of India, commented that India’s merchandise goods and services exports are estimated to have reached US$ 520-540 billion in 2018-19, resulting in a decline in the trade deficit by around US$ 10 billion. Merchandise exports are expected to have reached a record US$ 330 billion during 2018-19. However, India’s exports could be impacted due to unfriendly global headwinds in the current fiscal. The WTO has cut its forecast for growth in global trade from 3.7% to 2.6% in 2019, owing to persistent trade tensions, weak growth prospects for industrial countries as well as rising global