

The Agriculture Export Policy, 2018 has given a new thrust to agriculture export and the world has started looking at India with seriousness. What outcomes can we expect out of the document in the immediate present and future? One of the major features and objectives of the Agriculture Export Policy is to double the agricultural export and position India as a major agricultural exporter in the world. By this policy, the Prime Minister has already done the groundwork for doubling farm income. Various steps have already been taken like linking Indian produce to international market and towards processing food for global consumption as a value-added product. The Agriculture Export policy plays a vital role in various conversion rates for players, state government, central ministries, exporters and farmer-producer organisations with the aim of providing a major lift to our exports. Please elaborate on the salient features of this policy and how effective do you think it is going to be? Our prime focus is to participate in foreign events and hold Indian events. This gives an advantage to small size exporters who may not have enough funds to enter foreign markets. Another feature includes holding reverse buyer-seller meetings to further complement this policy. Is $60 billion agriculture export a farfetched idea? How are we going to achieve the target? No not at all, $60 billion is not a farfetched idea, especially if work is done on processed and value-added products. Working on these will not only provide us with economic benefits but also help highlight the name of our country on the world map in terms of value-added exports. How do we see WTO compatibility with the Agriculture Export Policy? As we know, the Agriculture Export Policy doesn’t talk about subsidies or incentives. The Agriculture Export Policy only addresses systemic issues and the steps involved in improving our pre and post-harvest along with various clusters for export; the manner in which we improve the quality of our products and manage more value-added products. It seeks to provide answers to questions of marketing and promotion. Hence, as such, WTO compatibility norms don’t concern us. You previously mentioned the idea of doubling the income of farmers. Therefore, how much time will it take for the benefits of the Agriculture Export Policy to reach the farmers? A major difficulty that we are seeing is bringing about the convergence of various stakeholders in India. For this purpose, a meeting was held to prepare a road map and various points were discussed and a helping hand is also required from the various state governments. No initiative is never easy, to begin with, but we believe that most state governments understand their responsibilities and the policy’s importance. Export chains earn a lot more than the non-export chains and, therefore, there is enough anecdotal evidence of farmers’ income going up in those clusters. Without proper post-harvest infrastructure support for smooth logistical movement of agriculture produce, farm to shipment will not get streamlined. What are the plans for improving on that front? The Pradhan Mantri Krishi Sinchai Yojana (PMKSY) is putting in major efforts to fill the gaps in agriculture like storage, icing, etc. that arise post-harvest. A separate logistics framework is being worked out. A separate committee had recently given its report about filling up of such logistical gaps and initiatives in the Agriculture Export Policy will help supplement its recommendations. How do you intend to minimise rejections on quality issues – sanitary and phytosanitary (SPS), along with the technical barriers to trade (TBT)? The Ministry of Commerce is currently trying to create an institutional mechanism where it will be the nodal agency. All departments under the ministry are aligned to meet them. The ministries of agriculture and animal husbandry, as well as the Indian Council of Agricultural Research (ICAR), are all working towards achieving this common goal. There are two ways to overcome these barriers. One is through mitigation measures, that is, to discuss and sort out with our partner countries. Second is adaptation measures on particular pesticides and agricultural issues, and then see how farmers react to such changeovers. Our tea exports to Iraq saw a major decline because of various factors such as stopping exports altogether or the inability to match quality requirements. How can such issues be best resolved? Any deficiency that happens at the level of exporters or importers, and the news that follows not only affect the business but is also damaging to the country’s reputation. Therefore, given the fragile nature of export chains, it is a must to be mindful of such sensitivities. How can we diversify export baskets, destinations and boost high-value and value-added agricultural exports, with a strong focus on perishables? More than 50% of our exports comprises of rice, meat and shrimp. So, to diversify we have to closely watch over the need for processed products. We have seen how countries like China, Vietnam and Thailand are working on value-added products along with organic foods to bring about an increase in their market value and have been fairly successful at it. India needs to do the same thing. What vision do you have regarding ‘Produce in India’ through Geographical Indication (GI)? We can use GI to appropriately brand our produce so that export volumes go up. How do we plan towards branding India? It has to be a joint exercise between the farmers and suppliers and under the Department of Industrial Policy and Promotion (DIPP) we are promoting specific brands that will further reach out to the globe and act as a catalyst for branding India. Farmers are often found to be lacking in confidence and they might resist giving up their land for cluster farming. How do we tackle this problem? If we are looking to develop these clusters where productivity can be enhanced, we have to first start with an awareness campaign. In this, each farmer is provided with a good education and certification
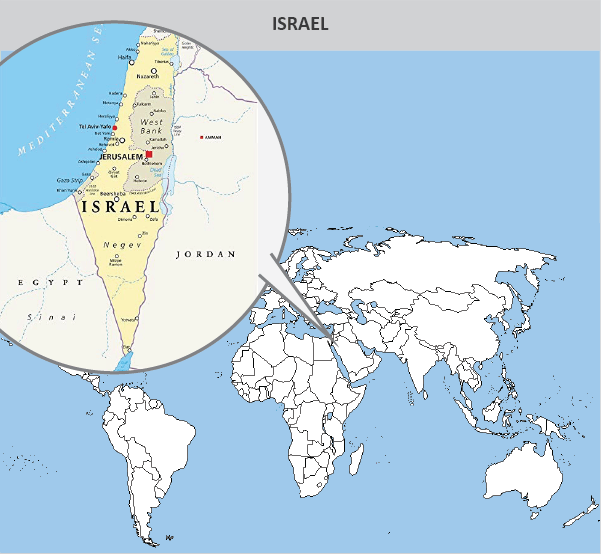
Country Profile: Israel
Israel is located in the Western Asia, close to Mediterranean Sea. It is a developed country with a very high HDI. The United Nations Development Programme ranks Israel 22nd in terms of Human Development Index with the value of 0.903. It is ranked 45th in ‘Ease of Doing Business’ by World Bank released in 2018. As per World Economic Outlook Database, 2018 estimate Israel is ranked 54th in world in GDP in PPP terms at a value of US$ 353.65 billion while ranked 32nd in GDP in nominal terms at a value of US$ 390.66 billion. The per capita GDP of Israel in PPP terms is estimated to be US$ 39106 and in nominal terms it is estimated to be US$ 43199 in 2018 by World Economic Outlook Database. TRADE STATISTICS In 2017, Israel imported US $ 69.12 billion worth of goods. Its export was over US $ 61.15 billion in value in 2017. The top trading partner of Israel is USA, followed by China and United Kingdom. India is ranked 10th in the list of top 10 trading partners of Israel, it has a import from Israel of worth US$ 1.99 billion and a significant export value of US$ 3.26 billion from India to Israel, resulting into a trade surplus of US$ 1.27 billion for India. ISRAEL’S MERCHANDISE TRADE WITH WORLD Israel’s exports to the world and imports from the world have a skewed pattern especially with countries such as China, Switzerland and Germany from which the imports to Israel are very high at the same time it maintains disproportionately high exports to USA. The country has maintained a trade deficit over the decade 2008-2017 except 2009 and 2015. In 2015 it had the highest trade surplus in the decade valued at of US $ 1.99 billion. ISRAEL’S EXPORT TO THE WORLD Israel’s total export in 2017 amounted to US $ 61.15 billion. Diamonds, pharmaceuticals and electronics are the primary export products of Israel. Its top export product at HS-6 digit level last year was Worked Diamonds, Medicaments -prophylactic, Non-industrial Unworked sawn diamonds, Electronic integrated circuits and Parts of aeroplanes or helicopters. These products constitute 43% of the total export basket of Israel, i.e. its export basket is highly skewed. ISRAEL’S IMPORTS FROM THE WORLD Israel’s import basket is primarily led by Crude Petroleum oils, Non-industrial unworked diamonds, Worked, unset diamond, Medium oils and Machines for manufacture of semiconductor devices which together make up the Top 5 imports of Israel. The import basket is primarily dominated by petroleum oil and diamond. INDIA- ISRAEL MERCHANDISE TRADE India consistently maintained a trade surplus with Israel since 2010. Surplus reached the highest in 2013 with a value of US$ 1.71 billion. Trade balance between saw an upsurge in favour of India from 2010 to There is no trend between India and Israel in terms of trade balance except that it has remained in favour of India in the last decade. INDIA’S EXPORT TO ISRAEL India’s total exports to Israel amounted to US $ 3.26 billion in 2017. Its top five exports at HS-6 digit level were Medium oils and preparations, Worked, unset Diamonds, Parts of machinery, Parts of aeroplanes or helicopters and Unworked Non-industrial diamonds. INDIA’S IMPORT FROM ISRAEL India’s total import from Israel in 2017 was US $ 1.99 billion. India’s import was dominated by Non-industrial unworked diamonds, Potassium chloride for use as fertiliser, Machines for the reception, conversion and transmission or regeneration of voice, Worked Diamonds and Herbicides – anti-sprouting products. Israel is an important focus of India’s current foreign policy. Between April 2000 and March 2017, cumulative foreign direct investment (FDI) from Israel to India reached US$122 million. While official data about India’s investment in Israel is not available, significant investments from India in Israel include acquisition of Israeli drip-irrigation company Naandan by Jain Irrigation, Sun Pharma’s 66% stake in Taro Pharmaceuticals, Triveni Engineering Industries investment in Israeli Aqwise Company, and others. In 2017 the two countries launched India-Israel Industrial R&D and Technological Innovation Fund (I4F), which comprises contribution of $20 million each from both countries, to promote research in futuristic technologies. A ‘Trilateral Fund’ of $50 million has also been created by Israel-India Technology Group (I-ITG) to promote entrepreneurship and trilateral business opportunities between the US, India and Israel. Israel is venturing into less explored areas of cooperation in India such as oil and gas, cyber security, films, and start-ups. India should focus on harnessing the expertise of Israel in agricultural technology to address the farm distress issue India is grappled in.

Trade Capacity Building and Sanitary and Phytosanitary Control
Agricultural and food markets are far more globally integrated than they were a decade ago. But many developing countries find it difficult to compete in the international agricultural marketplace, and seek trade-related technical assistance, especially to help them understand and respond to both government- and consumer-driven requirements of foreign markets, including sanitary and phytosanitary (SPS) measures. SPS measures are meant to safeguard the health and safety of consumers, and to protect animals and plants from certain kinds of risks. An effective SPS regime can also spur economic growth and job creation by protecting agricultural resources and the environment, diversifying the agricultural economy, adding value to agricultural products, and expanding and strengthening the agricultural sector. Unfortunately, developing countries have scant resources and few personnel in the public or private sectors familiar with SPS matters. In some cases, their food laws are outdated or they lack regulations to support food legislation. Nor do they have the regulatory means to control movement of goods and people across their borders, limiting their ability to curb the spread of pests and diseases affecting plants and animals. In addition, many developing countries have neither a mechanism for ensuring coordination between government agencies involved in human, animal, and plant-related standards, nor a common method for sharing information among themselves or with the public. Some have only one or two generalists to cover all SPS-related issues. This is especially burdensome when a country needs to assess the scientific justification that other countries offer for their SPS standards or needs to grasp how a new standard might affect their export prospects. Finally, many developing countries simply lack technical resources to equip and run standards organizations and laboratories. Defining what a particular country’s SPS infrastructure, programs, staffing, and specific requirements should be is no simple matter, however. Requirements vary with each country’s agricultural orientation (e.g., plants, animals, processed agricultural products), level of economic development, knowledge of SPS issues, physical and institutional infrastructure, major trading partners, and the frequency with which standards are tightened or updated in product lines of interest. Generally, however, a country’s SPS regime must be able to do three things: (1) Support domestic industry’s ability to meet SPS measures required by trading partners. (2) Implement trade-related SPS obligations (3) Participate in SPS-related trade discussions in international standard-setting organizations and the World Trade Organization (WTO). Producers must be aware of and able to meet the requirements of export markets. Some of these requirements are formal, set by governments, while others are informal, set by market actors, such as supermarket chains, in response to consumer demand. Meeting market requirements is a function both of producer capacity and the integrity of the SPS regime in the country of origin. Importing countries expect exporting countries to provide evidence that guarantees safe trade. Developing countries are responsible for implementing obligations outlined in WTO agreements. They must ensure that the standards they formulate and implement are consistent with obligations under the SPS Agreement; follow the principle of national treatment, which requires that SPS measures be applied to domestic food, plant, and animal sources just as they are to imports; and support measures that do not conform with an international norm with an appropriate risk assessment. Many developing countries lack the capacity to do any of these things. Furthermore, least developed countries often find it difficult even to comply with transparency obligations, and most developing countries find it difficult to assert their rights under the SPS Agreement. Many developing countries lack sufficient funds as well as personnel to participate regularly in international meetings that address SPS issues, including meetings of the WTO’s Committee on Sanitary and Phytosanitary Standards as well as meetings of international standard-setting organizations, such as the Codex Alimentarius Commission. Consequently, they may miss opportunities to become familiar with changes in SPS standards in key export markets or to influence deliberations. WTO needs to bring these issues as a core matter of discussion with requisite financial assistance provided to developing economies and LDCs.

Organic Food certification
With rising health consciousness and change in lifestyle organic food has emerged as the biggest revolution and food trend. In general organic food is certified through a certification process since organic farming differs from the conventional farming in terms of the whole agricultural process from ploughing to sowing. It is not mere avoiding chemicals but a comprehensive set of procedure. Thus there exist a range of certifications for the organic produce. In India there exist two type of certifications for organic produce. To have consonance with the international standards, the following bodies were formed in India to take steps to identify organic products and certify them: Agricultural and Processed Food Products Export Development Authority (APEDA) for implementing the National Programme on Organic Production (NPOP)-2001 National Centre for Organic Farming (NCOF) for implementing the Participatory Guarantee System in India-2016. Farm produce certification by APEDA- 1. Large-scale farmers or small size landholder growers groups (minimum of 25 and maximum of 500 farmers who possess land in the same geographical area) can apply for organic certification of their produce. It is pertinent to note that the certification is provided to produce and not the land. APEDA offers an internet-based e-service called Tracenet to collect, record and report data on organic certification. It is also used to trace any organic produce all the way to the farm from anywhere in the supply chain. 2. The organic certification process is carried out by accredited bodies under NPOP, accredited by NAB. There are 28 agencies accredited by APEDA. These certifying agencies verify farms, storages and processing units. Products certified organic by them carry the India organic logo. 3. Processed Food- NPOP- Separate standards are for handling, packaging, processing and storage. In India, section 3.5 of the NPOP lays down the general principles, recommendations and specific requirements for the use of organic labeling and claims. The labeling should convey unambiguous and accurate information on the product’s organic status.Farm produce certification under PGS– PGS-India is implemented by the National Centre of Organic Farming (NCOF) under the National Project on Organic Farming (NPOF), Department of Agriculture, Cooperation and Farmers’ Welfare, Government of India. PGS-India is a process based certification wherein a group certifies that its members are growing food organically. PGS-India controls the quality system through internal QMS through Farmer Grower Group Certification (GGC) instead of a certifying agency. NPOP certification based on Export and Import National Programme on Organic Production (NPOP) defines the regulatory mechanism and is regulated under two different acts for export and domestic markets. NPOP notified under Foreign Trade Development and Regulation Act (FTDR) looks after the export requirement. The NPOP notified under this act has already been granted equivalence by European Union and Sweden. USDA has also accepted the conformity assessment system of NPOP. Due to this, the product certified by any Indian accredited certification agency under NPOP can be exported to Europe, Sweden and USA without the requirement of re-certification. To look after the requirement of import and domestic market the same NPOP has been notified under Agriculture Produce Grading, Marking and Certification Act (APGMC). Due to the equivalence commanded by the NPOP certification in several developed countries and its third party verification system, it has remained a preferred choice. However it is an expensive process as compared to PGS certification. Thus the government should explore the possibility of bilateral agreement with the countries showing interest in procuring the same for facilitating export of PGS certified organic produce since it provides level playing field to the marginal and small farmers. Another possibility exists for extending interoperability between the two certifications operational in India viz. NPOP and PGS certification. India is at the cusp of organic revolution as per FIBL & IFOAM Organics International Year Book 2018 India is ranked 9th in in terms of World’s Organic Agricultural land and 1st in terms of total number of organic producers. As per APEDA database, India produced around 1.70 million metric tonnes (2017-18) of certified organic products in 2017-18.
Are Regional Trade Agreements good for economy?
The proliferation of regional trade agreements has continued unabated since the early 1990s. In recent years, this has led to widespread debate on the advantages or disadvantages of regionalism over multilateralism. The debate stems from the increased use of regional trade agreements (RTAs) in a world now ruled by an improved and disciplined multilateral trading system. The key question is whether these agreements will push the world toward discriminatory regionalism, or can be used as a vehicle for promoting multilateralism. Regional trade agreements of all variety span the globe. As more and more states form these associations, they have become an ever more popular area of academic enquiry. The structure of regional agreements varies hugely, but all have one thing in common — the objective of reducing barriers to trade between member countries. At their simplest, they merely remove tariffs on intra-bloc trade in goods, but more now go beyond that to cover non-tariff barriers and to extend liberalisation to trade and investment. On the whole, the newer agreements tend to have deeper coverage, extending into areas of domestic disciplines beyond the exchange of tariff concessions, and a number of agreements now also cover the services sector and other areas of cooperation. In this context, it is difficult to arrive at a clear conclusion on India’s stance on RTAs. To do so requires careful consideration of India’s place in the global economy, and the impact of potential trade diversion on its domestic industries. Traditionally, India has been a supporter of the multilateral system, but given the slow pace of negotiations and the developmental needs of its economy, it too has recently joined the RTA bandwagon. Clearly RTAs may affect the setting of external tariffs. This is true by definition in the case of a customs union and indirectly true in the case of a free trade area. Recent research finds that World Trade Organization (WTO) members do not appear to have more liberal external trade policies than non-WTO members, and that membership in a RTA has, on average, no clear effect on a country’s trade policy. Member countries of successful trade agreements in effective regional groupings, distinguished by the growth of intra-area trade, have undertaken more far-reaching trade liberalization including standardization of non-tariff barriers. However, there are cases of liberalizing countries that did not belong to an RTA and of countries in an effective RTA that did not liberalize trade policy. The conclusion is that the acceptance of a liberal trade policy covering major instruments may be a requirement for the survival and deepening of a meaningful RTA, whereas belonging to a regional scheme constitutes neither a necessary nor a sufficient condition for an open and liberal trade regime. In the 1960s and 1970s, preferential agreements among developing countries were typically accompanied by high external tariff barriers as part of an import substitution strategy. In contrast, agreements among more developed countries in the same period were more often associated with declining external barriers. For example, the simple average external tariff of the original six members of the European Union fell from 13 percent in 1958 to 6.6 percent after the Kennedy Round of General Agreement on Tariffs and Trade (GATT) negotiations. Agricultural products were excluded from these reductions, reflecting their exclusion from GATT negotiations until the Uruguay Round. The failure to reduce agricultural tariffs in Europe led to substantial trade diversion in agriculture with significant welfare losses for European consumers, especially the poorest, and a considerable hardship for poor farmers in developing countries. Many developing countries have since reduced external tariff barriers both unilaterally and through multilateral negotiations. As a result, recent preferential agreements among many developing countries have been introduced or revamped with lower external barriers. This is particularly true in Asia and Latin America, where preferential and MFN tariffs declined in tandem after 1985, so that margins of preference remained stable or were slightly compressed. The U.S. and EU have the largest trading and investment relationship in the world. A reduction of tariffs and non-tariff barriers will significantly impact on both the U.S. and EU economies, and increase leverage for both the U.S. and EU in negotiating future agreements with third countries. This agreement marks the historic shift away from multilateral trade discussions in favour of bilateral or regional trade agreements – a positive shift that will ultimately result in greater volumes of international trade. Finally, this agreement sets the stage for a greater polarization between “the West and the rest”. A stronger alliance between the most developed countries will inevitably create tensions with other global powers not benefiting from the same tariff and non-tariff treatment. This is an important, albeit negative development Despite Chinese investments in the region, India remains a leading actor in South Asia given its historic trading routes and sociocultural ties with neighbouring countries. India’s focus on developing its infrastructure for both domestic manufacturing and cross-border transportation is also likely to benefit foreign invested companies in the region as it opens up new market opportunities”. Thus what we need to work on the “state of art” to realize the potential through regional trade agreement.

Product Profile: Spices
India, contemporarily known as the home of spices, has a long trading history with ancient and medieval civilizations of the world. Ancient trade routes connected India with Europe, Middle East and the rest of the world exists as a testimony to world’s preference for Indian spices since ancient times. Indian spices are known for its exquisite aroma and medicinal properties. Moreover, India has the world’s largest domestic market for spices. India’s Present Scenario Presently, India is the world’s largest producer, consumer and exporter of spices. It produces about 75 of the 109 varieties of spices listed by the International Organization for Standardization (ISO) and accounts for half of the global trading in spices. Top spices produced in India include pepper, cardamom, chilli, ginger, turmeric, coriander, cumin and others. Kerala is the topmost spice producing state in India and is also the largest producer of Pepper and Cardamom. The top importers of Indian spices in 2017 were: Vietnam, USA, Malaysia, Thailand, Sri Lanka, UAE and UK. India has remained the topmost world exporter of spices throughout, followed by Vietnam and China. India’s spice exports accounted a phenomenal 16 per cent CAGR (10 years). In terms of value, the top spices exported by India in 2017 at HS-6 digit level were Chilli, Cumin Seeds and Turmeric. The individual yearly growth rate of these spices were also the highest, among the top spice product exports of India in 2017 (as per value terms). The top imported spices in the world in 2017 were Whole Pepper (USD 2.2 billion) and Capsicum (USD 1 billion). India was the fifth largest exporter of Whole Pepper in 2017. USA was the largest world importer of spices in 2017, followed by Germany and Vietnam. India was the largest exporter of spices to USA, preceded by Vietnam. The top export of India to USA was crushed or ground pepper. Countries such as Germany and France largely imports Vanilla, followed by Pepper. However, despite having a steady potential in exports of Pepper, India has been unable to tap it as the countries import pepper mostly from Vietnam, Indonesia and Brazil. Indigenous Spices of India, of which the global imports has increased at a steady rate in terms of CAGR (2013-2017) were Ginger (15 per cent), Cumin Seeds (26 per cent) and Turmeric (17 per cent). Of the top world importers of spice, India’s export share is largest for Saudi Arabia, followed by USA. Vietnam, which is the second largest world exporter of Spices, imports Capsicum and Cumin seeds from India in large quantities. Future Prospects: The population in India is surging and the increasing consumer expenditure on food explains the swelling demand for food in India. Accordingly, the demand for spices is expected to grow in the future which will lead to a prominent growth in the revenues from the sales of spices in India. According to a report of a leading market research firm in India, the revenues from the Indian market are expected to expand to around USD 18 billion in FY’2020. The highest contribution to this growth is expected to come from the spice mixes and blended spices. Spices, being the flavoring agents have always seen a stable growth and is expected to grow consistently.

Value added F&B products: The shift that India needs the most
Draft Agri export policy 2018 aims to increase India’s export from US$ 30 billion to US$ 60 billion by 2022. It is a commendable initiative since now the country has shifted its focus towards agricultural exports rather than just production and domestic consumption. India is a leading agricultural commodity producer in many commodities such as rice, wheat and pulses etc. however a significant proportion of it gets consumed within the country owing to its large population. Taking cognizance of it, the most important component of the released draft agricultural export policy 2018 is that it calls for focus on value added food and agricultural product export. As per the released agricultural export policy the share of India’s high value and value added agricultural produce in its agricultural export basket is less than 15% for India compared to 25% in US and 49% in China. The policy draft document cites the example of Cashew apple jams and pastes, flavoured cashew, etc. It mentions that less than 4% of cashew exports are in value added form currently. Also under the organic products, agricultural export policy 2018 mention that only 5.5% of organic food export is processed. Under the strategic recommendations draft agricultural export policy 2018 mentions a few value added products along with their projected and current exports thus evincing that huge opportunity exists for these products. Also it depicts that the potential market for such product is regionally diversified from African nations such as Angola to USA. The scope to export value added products remain immense. Some of the primary issues with the raw commodity export is that its demand is inelastic, it is more vulnerable to price fluctuations owing to volatility in production and its inherent dependence to agro climatic conditions and associated volatility. However value addition unleashes the scope to command more price in the global market and generate employment opportunities in the food processing sector. One such case study is of sweet biscuit. Europe’s biscuit import in 2017 was USD 3.7 billion. India’s export is at miniscule US$ 1.2 million. India’s current (2017) share in Europe’s sweet biscuits import is 0.0003%. If we could take it to 5%, it could bring USD 183.9 Million of additional revenue by simply processing wheat and sugar, otherwise abundantly available in the country. TPCI highlighted sweet biscuits as a potential product for export from India to World through its presentation to MOCI. As per FSSAI, as on 2017, 30,413 Central licenses have been issued to Food Business Operators while 7,92,780 licenses have been issued to Food Business Operators by the State and UTs Licensing Authorities. It evinces that for a country which has an unparalleled agricultural production capacity has as low as 30413 licensed food processing units with an export capacity. India as a land of large number of products preferred by world such as saffron, cardamom etc. needs to look beyond producing for the domestic market but think for capturing the globe with its value added products. Develop a product which the whole world demands, perhaps that would revolutionise India’s value added product exports.
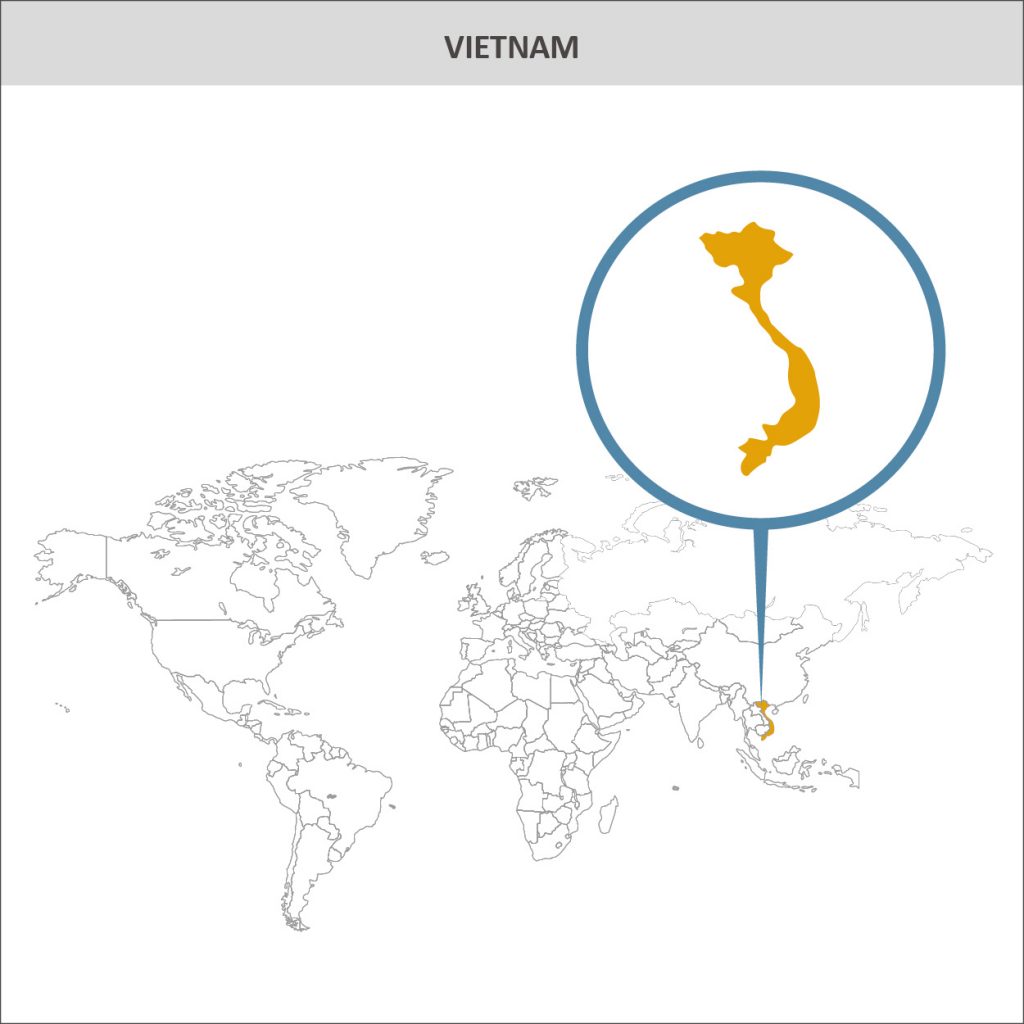
Country Profile- Vietnam
Vietnam is located in easternmost part of South Asian Continent. It is a developing country and is a member to the most successful regional economic group-ASEAN. The United Nations Development Programme ranks Vietnam 116th in terms of Human Development Index with the value of 0.649. It is ranked 69th in ‘Ease of Doing Business’ by World Bank released in 2018 with 21st rank in dealing with construction permits and 27th rank in getting electricity. As per World Economic Outlook Database, 2018 estimate Vietnam is ranked 35th in world in GDP in PPP terms at a value of US$ 705.78 billion while ranked 47th in GDP in nominal terms at a value of US$ 240.78 billion. The per capita GDP of Vietnam in PPP terms is estimated to be US$ 7463 and in nominal terms it is estimated to be US$ 2546 in 2018 by World Economic Outlook Database. TRADE STATISTICS In 2017, Vietnam imported US $ 210.63 billion worth of goods. Its export was over US $ 213.93 billion in value in 2017 which accounted for 1.2 % of the total exports in the world. As per ITC trade map Vietnam ranks 28th among the top world exporters, list is led by China. The top trading partner of Vietnam is China, followed by USA and South Korea. India does not rank in the list of top 10 trading partners of Vietnam, but has a significant import from Vietnam of worth US$ 4.15 billion and an export value of US$ 8.12 billion from India to Vietnam, resulting into a trade surplus of US$ 3.97 billion for India. VIETNAM’S MERCHANDISE TRADE WITH WORLD Vietnam’s exports to the world have followed its path of imports throughout, as can be seen in the graph below with an exception of South Korea and USA from where Vietnam has significantly higher imports and exports respectively. The country has maintained a trade surplus post 2012 barring 2015. Before 2012, Vietnam maintained a trade deficit with the world. In 2017 it had the highest trade surplus in the decade valued at of US $ 3.31 billion. VIETNAM’S EXPORT TO THE WORLD Vietnam’s total export in 2017 amounted to US $ 213.9 billion. Natural resources are the primary export products of Vietnam. Its top export product at HS-6 digit level last year was telephones for cellular networks, Parts of telephone sets for cellular networks, Electronic integrated circuits, Sports footwear and Fresh or dried cashew nuts. These products constitute just 28% of the total export basket of Vietnam, i.e. its export basket is much diversified. VIETNAM’S IMPORTS FROM THE WORLD Vietnam’s import basket is primarily led by Parts of telephone sets for cellular networks, Electronic integrated circuits for processors and controllers, Electronic integrated circuits excluding processors and controllers, Medium oils and Printed circuits which together make up the Top 5 imports of Vietnam. The import basket is primarily dominated by HS code 85 i.e. electrical machinery and equipment. INDIA- VIETNAM MERCHANDISE TRADE India consistently maintained a trade surplus with Vietnam. Surplus reached the highest in 2017 with a value of US$ 3.97 billion. There is no trend between India and Vietnam in terms of trade balance except that it has remained in favour of India in the last decade. INDIA’S EXPORT TO VIETNAM India’s total exports to Vietnam amounted to US $ 8.12 billion in 2017. Its top five exports at HS-6 digit level were Frozen boneless bovine meat, Frozen shrimps and prawns, Flat-rolled products of iron or non-alloy steel, Frozen fish, Raw Cotton (neither carded nor combed) and Fruits of the genus Capsicum. INDIA’S IMPORT FROM VIETNAM India’s total import from Vietnam in 2017 was US $ 4.12 billion. India’s import was dominated by Parts of telephone sets for cellular networks, Wire of refined copper, Cross section <= 6 mm, Parts of automatic data-processing machines, Tubes and pipes of refined copper and Aluminium oxide. The import basket of India for the products imported from Vietnam is primarily dominated by electrical machinery and equipment and copper and aluminium wires. Vietnam is an important focus of India’s act east policy. Vietnam along with other ASEAN countries participated as the Chief Guest in last republic day parade of India. India has an FTA with ASEAN resulting into a significant trade with the south Asian countries. According to statistics published by the Foreign Investment Agency under the Ministry of Planning and Investment, Vietnam as of December 2017, India invested in 169 projects in Vietnam with total investment capital of $756 million. Further in 2017 alone, Indian firms poured $187.5 million into Vietnam, equal to 25 per cent of the total FDI from India in the past 30 years. India’s Council of Agricultural Research and Vietnam’s Ministry of Agriculture and Rural Development designed a comprehensive work plan for 2018-2020 to promote the transfer of technology and technical expertise in the field of agriculture and its allied sectors. India has been a vocal supporter of Vietnam’s claim in the South China Sea on freedom of navigation and sovereignty issues. Recently India and Vietnam decided to step up defence cooperation and oil exploration to boost their bilateral ties in the South China Sea.
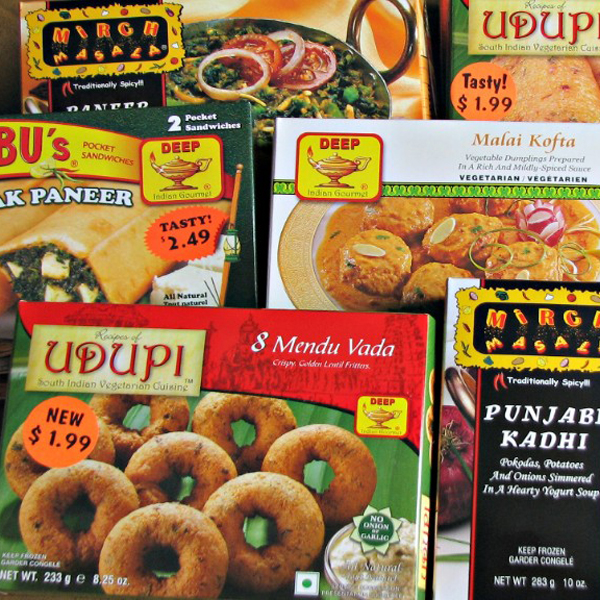
Product Profile : Indian Ethnic Food
As per the Draft Agriculture export policy 2018 by Ministry of Commerce and Industry Indian ethnic foods export is valued at USD 114 million currently. It has been projected to grow at USD 200 million in the next three years. India’s domestic market for Indian ethnic ready to eat and ready to cook too is growing very rapidly. Finally Indians are gradually moving to ready to eat ethos. As we all know, the number of Indians not just traveling but also settling overseas is increasing day by day. And the number is definitely not coming down anytime soon. Again, it’s a known fact that the number of Indian restaurants and stores abroad are not as many as we would like them to. What’s the solution to this? The ready to eat Indian food! Hence, the demand for ready to eat Indian food exporters is at an all-time high. As per the Ministry of External Affairs, population of overseas Indian is estimated to be 31 million. This huge overseas Indian population all over the world represent a cumulative buying power that can rival the domestic Indian market. But this is not the only reason why this instant food is preferred so much across the seas. Many foreigners too relish Indian food especially after global shift towards vegetarianism. Population of Overseas Indians (Compiled in December, 2018) SI. No. Country Overseas Indians 1 Afghanistan 2,969 2 Albania 52 3 Algeria 3,516 4 Andorra 160 5 Angola 4,000 6 Anguilla 20 7 Antigua & Barbuda 550 8 Argentina 2,400 9 Armenia 1,500 10 Aruba 1,000 11 Australia 496,000 12 Austria and Montenegro 31,000 13 Azerbaijan 977 14 Bahamas 300 15 Bahrain 316,175 16 Bangladesh 10,391 17 Barbados 2,214 18 Belarus 487 19 Belgium 19,202 20 Belize 10,050 21 Benin 1,563 22 Bhutan 60,000 23 Bolivia 60 24 Bonaire & Smaller Islands 200 25 Bosnia & Herzegovina 26 26 Botswana 12,000 27 Brazil 5,073 28 British Virgin Islands 60 29 Brunei Darussalam 11,598 30 Bulgaria 162 31 Burkina Faso 205 32 Burundi 500 33 Cambodia 1,510 34 Cameroon 245 35 Canada 1,016,185 36 Cape Verde Islands 20 37 Cayman Islands 1,510 38 Central African Republic 10 39 Chad 120 40 Chile 3,500 41 China 56,020 42 China (Hong Kong) 38,419 43 China (Rep. of) (Taiwan) 3,446 44 Colombia 218 45 Comoros 230 46 Congo (Dem. Rep. of) 9,025 47 Congo (Republic of) 358 48 Cook Island 205 49 Costa Rica 250 50 Cote d’Ivoire (Ivory Coast) 1,500 51 Croatia 80 52 Cuba 700 53 Curacao 1,500 54 Cyprus 5,858 55 Czech Republic 2,400 56 Denmark 11,200 57 Djibouti 350 58 Dominica (Commonwealth of) 215 59 Dominican Republic 175 60 East Timor 70 61 Ecuador 90 62 Egypt 3,765 63 EI Salvador 17 64 Equatorial Guinea 250 65 Eritrea 303 66 Estonia 956 67 Ethiopia 5,273 68 Fiji 315,198 69 Finland 11,775 70 France 109,000 71 France (Reunion Island) 280,250 72 France (Guadeloupe, Martinique, St. Martin) 67,220 73 Gabon 110 74 Gambia 716 75 Georgia 3,200 76 Germany 146,093 77 Ghana 10,000 78 Greece 12,500 79 Grenada 5,200 80 Guatemala 83 81 Guinea (Republic of) 700 82 Guinea Bissau 104 83 Guyana 297,793 84 Haiti 580 85 Holy See 0 86 Honduras 17 87 Hungary 1,150 88 Iceland 333 89 Indonesia 107,500 90 Iran 4,273 91 Iraq 10,000 92 Ireland 34,000 93 Israel 97,467 94 Italy 197,301 95 Jamaica 80,000 96 Japan 28,717 97 Jordan 20,207 98 Kazakhstan 5,750 99 Kenya 80,000 100 Kiribati 50 101 Korea (DPR) 15 102 Korea (Republic of) 11,526 103 Kuwait 929,903 104 Kyrgyzstan 4,814 105 Laos, PDR 500 106 Latvia 785 107 Lebanon 8,537 108 Lesotho (Kingdom of ) 1,500 109 Liberia 3,000 110 Libya 1,502 111 Liechtenstein (Principality of ) 10 112 Lithuania 300 113 Luxembourg 2,372 114 Macedonia 15 115 Madagascar 17,500 116 Malaysia 2,987,950 117 Malawi 10,500 118 Maldives 25,108 119 Mali 299 120 Malta 2,000 121 Marshall Islands (Republic of) 15 122 Mauritania 60 123 Mauritius 894,500 124 Mexico 9,600 125 Micronesia 1 126 Moldova 198 127 Monaco 70 128 Mongolia 155 129 Montserrat 240 130 Morocco 354 131 Mozambique 32,500 132 Myanmar 2,008,991 133 Namibia 259 134 Nauru 20 135 Nepal 600,000 136 Netherlands 235,000 137 Netherlands Antilles 6,281 138 New Zealand 200,000 139 Nicaragua 12 140 Niger 150 141 Nigeria 40,035 142 Norway 20,018 143 Oman 689,145 144 Pakistan 0 145 Palau (Republic of) 15 146 Palestine (PLO) 20 147 Panama 13,000 148 Papua New Guinea 1,500 149 Paraguay 600 150 Peru 454 151 Philippines 120,000 152 Poland 4,600 153 Portugal 73,244 154 Qatar 692,039 155 Romania 1,053 156 Russian Federation 30,560 157 Rwanda 3,000 158 Samoa 70 159 San Marino 0 160 Sao Tome and Principe (Rep. of) 50 161 Saudi Arabia (Kingdom of) 2,814,568 162 Senegal 532 163 Serbia 63 164 Seychelles 10,000 165 Sierra Leone 950 166 Singapore 650,000 167 Slovak Republic 250 168 Slovenia 130 169 Solomon Islands 20 170 Somalia 100 171 South Africa 1,560,000 172 Spain 55,308 173 Sri Lanka 1,614,000 174 St. Kitts and Nevis 750 175 St. Lucia 5,255 176 St. Martin 5,300 177 St. Vincent & the Grenadines 3,050 178 Sudan 2,700 179 South Sudan 1,500 180 Suriname 154,471 181 Swaziland 1,000 182 Sweden 25,719 183 Switzerland 24,567 184 Syria 107 185 Tajikistan 1,125 186 Tanzania 60,000 187 Thailand 195,000 188 Togo 510 189 Tonga 46 190 Trinidad & Tobago 556,800 191 Tunisia 137 192 Turkey 1,708 193 Turkmenistan 482 194 Turks & Caicos Islands 235 195 Tuvalu 50 196 Uganda 30,000 197 Ukraine 7,963 198 UAE 3,104,586 199 UK 1,825,000 200 USA 4,460,000 201 Uruguay 530 202 Uzbekistan 382 203 Vanuatu 810 204 Venezuela 110 205 Vietnam 3,300 206 Yemen 10,500 207 Zambia 23,000 208 Zimbabwe 9,500 Many brands have emerged in the space to cater to the 31 million Indian diaspora who crave for Indian food. Major players in the ready to eat food industry in India are Nestle, Kelloggs, H.J Heinz, ConAgra, ADF Foods Ltd, ITC Ltd, Kohinoor Foods Ltd, Vadilal
Agriculture to boost India’s trade surplus?
India’s agricultural trade surplus recorded a more than ten-fold increase between 1991-92 and 2013-14. Three years later, the picture is vastly different. Between 2013-14 and 2016-17, agricultural exports fell by 22% while imports increased by 62%. As a result, the trade surplus has fallen by 70%. How can the tide be reversed? What steps need to be taken to boost India’s trade surplus? To know the answer, let us first take a look at the trends in agri-trade, both exports and imports, during 2004-05 to 2016-17. Broadly speaking, both agri-exports and imports have increased substantially since 2004-05. India’s Agri-trade increased from US$14 billion to US$59.2 billion between 2004-05 and 2016-17. As a share of agri-GDP, it increased from 11.1% in 2004-05 to 16.7% in 2016-17, after peaking at 19.6% in 2012-13, reflecting the increasing integration of Indian agriculture with global markets. Interestingly, between 2004 and 2014, the agri-trade surplus surged seven-folds, from US$3.6 billion in 2004-05 to US$25.4 billion in 2013-14, but then fell dramatically by two-thirds, touching US$8.2 billion by 2016-17. This falling agri-trade surplus was the result of falling exports and rising imports. Agri-exports, after peaking at US$42.9 billion in 2013-14 fell to US$33.7 billion in 2016-1, while imports kept rising from US$ 17.5 billion in 2013-14 to US$25.5 billion by 2016-17. This fall in agri-exports was primarily from significant fall in exports of cereals (especially wheat and maize), cotton, oilseeds complex and, to some extent, bovine meat. This, in turn, was largely due to a steep fall in global prices on one hand and restrictive export policies on the other. To cite an example, the global prices of wheat, maize, soybean, and cotton fell by 47%, 39%, 25% and 18%, respectively, during 2013-16. The FAO food price index fell from 209.8 in 2013 to 161.5 in 2016. Export policies for pulses, oilseeds/edible oils, several vegetables, etc. was restrictive. Nevertheless, exports of fish-seafood, and fruits-nuts-vegetables (mainly guavas/mangoes, grapes, cashew nuts, onions) have been growing steadily touching US$5.8 billion and US$ 3 billion, respectively, in 2016-17. Agricultural imports have been rising continuously since 2004-05. Edible oils (US$11.3 billion), pulses (US$4.3 billion), and fruits, nuts, vegetables (US$3.1 billion) together touched US$18.7 billion out of a total agri-import of US$25.4 billion in 2016-17. Mr. Suresh Prabhu, the Minister for Industry and Commerce, had upon taking charge of the Ministry expressed his resolve to expand export to reverse this trend. Thereupon, the Ministry worked on a strategy to ‘revitalize’ India’s exports and came up with the Agri-Export policy having well-defined sectoral, commodity and territory specific export strategy after consultation with “different ministries and stakeholders” like TPCI, which was part of several such meetings and presentations made to the officials of various concerned ministries. Raising agricultural exports to first narrow down the difference and then boost trade surplus requires several steps to be taken, many of which will come into effect after proper and full execution of Agri-Export Policy. The most important step that has been incorporated in the agri-export policy is focus on contract farming on a medium-to long-term basis. Proper laws need to be framed so that farmers do not feel threatened in giving their lands for contract farming. Further, it is essential to develop efficient global value chains and liberalize land lease markets across India. Raising agricultural exports requires the government to unburden policy of consumer bias. A balance should be struck between meeting the needs of food-insecure consumers and income-insecure farmers. If the farmers income need to be doubled, as envisaged by Hon’ble Mr. Narendra Modi, the middle-man dependence need to be minimized to the extent possible, and exporters and processors must be encouraged to buy directly from farmer-producer organizations (FPOs). There is need to create the back-end infrastructure so as to enthuse foreign and Indian companies to invest in processing and packaging in a big way. Infrastructure also need to be put in place for global and domestic value chains, ranging from produce aggregation to its sorting and grading, packaging, storing and linking the farmlands to ports export markets. Focus on infrastructure related to technology build-up, in cold-chains & storage, ware houses, food processing set-ups, values addition, disease resistance, dehydration is required besides providing incentives for mechanization in farming, horticulture and marine technologies. Focus on organic farming, on which the Agri-Export policy lays great focus, will be important to increase exports. There is still great uncertainty about the rules and certifications related to organic farming, which need to be eased and brought under single-window. Focus on branding on key Indian produce that is specific to India will be required if we are to promote Indian branded produced to the world. Agri export policy talks in detail about branding, which is one of the most salient features of this policy. Darjeeling Tea is a GI but the world does not relate Darjeeling Tea with India. The Government can also think of creating ‘Make in India’ or ‘Produce from India’ branded stickers for export produce. Ministry of Earth Science can be roped in to provide accurate agriculture forecasting for the farmers. Efforts need to be focused on scientific estimate of crop production, buffer stock, future projection and domestic demand. India will have to build global value-chains for some important agri-commodities where we have a comparative advantage. Estimates of revealed comparative advantage show that India is export competitive in almost 70% of agricultural commodities, non-tradable – i.e. our prices are between import parity (cif) and export parity (fob) prices – in about 10-15%, and import competitive in the remaining 15-20% commodities. On the exports front, India is relatively competitive in cereals – especially rice and, at times, in wheat and maize – oilseeds, especially groundnuts, and oil meals. But it is fish and sea-food, bovine meat, and fruits, nuts and vegetables, where we have great potential to grow. And these are the commodities to focus on for stimulating agri-exports. Last, but not the least, India need to create value-added products catering to international tastes and standards, to grow agri-based food