

• Endowed with an abundant supply of raw cotton, India is the largest exporter of cotton yarn in the world. • India’s cotton yarn exports have plunged 35% in the first quarter of FY’20 to US$ 696 million compared to US$ 1.1 billion in the same period last fiscal. • This is a result of external factors including weak international demand, tax sops to competing nations like Bangladesh & Vietnam as well as internal factors like higher prices in the domestic market & rising costs of Indian raw cotton. • In order to arrest these challenges, India can consider expanding the scope of RoSCTL and negotiating for matching tariff structures. Exporters will also have to also look towards diversifying their markets. Blessed with favourable geographical conditions including a tropical weather (24 degrees celsius), saline soil and ample rain (600-1000 cm), India is known all over the world for its excellent quality of cotton. In fact, back in the day, the popularity that India’s fine cotton enjoyed in the niche markets of Europe not only filled the coffers of British East India Company, but also made it one of the richest and most powerful corporations in the 18th century. India still maintains its supremacy as a fine cotton producing region and is one of the largest cotton producers in the world. Producing 4 varieties of cotton, India accounts for around 25% of the total global fibre production and has the largest area under cotton cultivation on the planet i.e. about 11 million hectares. India also has the second largest cotton spinning infrastructure in the world. Top cotton yarn exporters in the world Value exported in 2018 (US$ million) Quantity exported (tons) India 3,840.6 1,220,425 Viet Nam 2,263.3 764,667 China 1,272.3 275,450 Pakistan 1,202.2 457,573 USA 1,105 384,310 Uzbekistan 720.6 273,618 Indonesia 505.2 170,636 Turkey 502.2 150,810 Hong Kong 411.6 98,757 Taipei 207.1 97,203 Source: ITC Trade Map Endowed with an abundant supply of raw cotton, India was indubitably the largest exporter of cotton yarn in the world in 2018 and exported 1,220,425 tons of cotton yarn amounting to US$ 3,840.6 million. However, the situation is likely to be unpleasant in the coming years. According to the Confederation of Indian Textile Industry (CITI), India’s cotton yarn exports have plunged 35% in the first quarter of FY20 to US$ 696 million compared to US$ 1.1 billion in the same period last fiscal. This has been the result of a string of domestic and international factors which are closely knitted. For starters, in Indian markets, cotton yarn fetches higher prices than in international ones, leading to a slide in the exports. Further, the government’s farmer-friendly policies have proved detrimental for the cotton exporters. For instance, the decision of the government to go ahead with a 28% hike in MSP has led to the distortion of prices in the global markets, thereby dealing a blow to India’s competitiveness. Further, India has also started losing out its share in its traditional export markets like China to competition from other countries like Bangladesh, Pakistan & Vietnam. This is because China has given duty-free access to countries like Pakistan and Vietnam since April 1, 2019. On the other hand, Indian yarn attracts duty of 3.5-4%. This has significantly brought down the cost of their cotton yarn at a time when Indian raw cotton price is touted as the highest in the world. At the same time, be it India or international markets, there is a general dip in consumption amidst the global slowdown and weak employment growth. Exports to both EU and China have fallen by 25% over 5 years. This has fanned fears in India that if this trend goes unchecked, it may lead to the closure of many factories and mass layoffs. Given the fact that 40-50 million people in India are engaged in cotton processing and trade according to the Ministry of Textiles, this development is quite disturbing. In order to arrest this situation, the government has already set up an inter-ministerial committee of secretaries. One of the things that the committee can consider is to widen the ambit of the Rebate of State and Central Taxes and Levies (RoSCTL) scheme to yarn and fabrics as well (presently for garments). This will allow reimbursement of duties on export inputs and indirect taxes via freely transferable scrips (i.e. incentives that can be used to pay duties). Cotton yarn exports currently attract 5-6% of embedded taxes such as agricultural cess, mandi tax, power and fuel surcharge. There is also a demand from the industry to devise a scheme along the lines of Merchandise Exports from India Scheme (MEIS), which provides tax sops to cotton yarn exporters in a manner that does not infringe on WTO norms. The government could also switch to other modes like direct benefit transfer in order to raise the standard of living of Indian farmers instead of increasing the MSP of crops. Moreover, India is still exporting a lot of raw cotton to markets with zero duty, which is not getting converted to yarn or fabric. This leads to a considerable loss of foreign exchange and employment generation. Exports of cotton reached US$ 2 billion in 2018-19, so adequate incentives for value addition are the need of the hour. Given the tariff disadvantage in cotton yarn and fabric exports, the industry should consider the option of diversifying its markets. Cotton yarn exporters could explore the markets of Turkey, Portugal, Japan & Germany, as they would have to pay low tariffs in these markets.
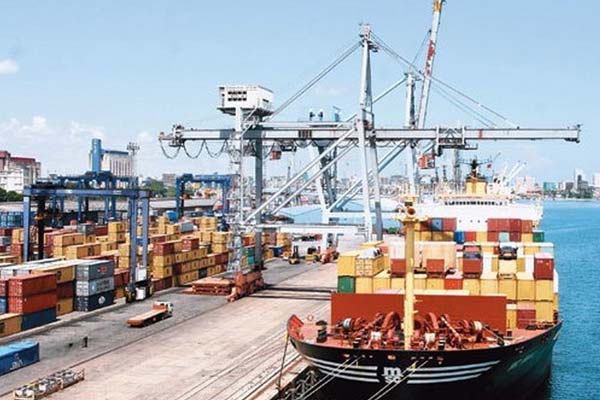
Ocean Economy & Maritime Trade: Exploring possibilities
• Oceans have become the primary conduits of international trade and are central to growth of the global economy. • The value of the global ocean-based economy is estimated between US$ 3-6 trillion/year and more than 3 billion people rely on the oceans for their livelihoods. • From the value of linear shipping connectivity index (LCSI) over 2006 to 2019, it can be observed that connectivity of China is relatively robust followed by USA, Germany, Japan and then India. • India has a 7,517 km long coastline along with 14,500 km of potentially navigable waterways and strategic locations along major international maritime trade routes. Still India’s coasts only contribute to 15% of national trade activity. Oceans and seas cover over two-thirds of the earth’s surface and are being utilized as a resource for eclectic purposes like providing food and minerals, absorbing greenhouse gases, generating oxygen, keeping climate change in check, determining weather patterns and temperatures, and serving as highways for sea-borne international trade. Oceans and seas can play a key role in contributing to sustainable development, economic growth, and livelihoods. The value of the global ocean-based economy is estimated between US$ 3-6 trillion/year and more than 3 billion people rely on oceans for their livelihoods. According to a recent report by the World Bank and the UN, there is no universal definition of Blue Economy. Instead, it prefers to spell out the characteristics of a sustainable Blue Economy: • Provides social and economic benefits for current and future generations by contributing to food security, livelihoods, poverty eradication, income, employment, health, safety, equity and political stability. • Restores, protects, and maintains the diversity, productivity, resilience, core functions, and intrinsic value of marine ecosystems the natural capital upon which its prosperity depends. The concept of a “blue economy” emerged in 2012 as countries around the world grappled with the twin trends of accelerating growth in the ocean economy and changes in the underlying ecosystems. The blue economy concept is shorthand for policies that promote sustainable development of the ocean economy, where economic growth does not reduce the aggregate natural capital, and conservation of ecological commons contributes to poverty reduction. Quick facts • The worldwide ocean economy is valued at around valued at around US$ 1.5 trillion per year. • 80% of global trade by volume is carried by sea. • 350 million jobs world-wide are linked to fisheries. • By 2025, it is estimated that 34% of crude oil production will come from offshore fields. • Aquaculture is the fastest growing food sector and provides about 50% of fish for human consumption. Area Workable domains Fishing Capture fishery, aquaculture, seafood processing export Marine biotechnology Pharmaceuticals, chemicals, seaweed harvesting, seaweed products, marine derived bio-products Maritime logistics Ship management, liner and port agents, port companies, ship suppliers, container shipping services, stevedores, roll-on roll-off operators, custom clearance, freight forwarders, safety and training Maritime tourism Sail boarding, sea kayaking, scuba diving, swimming in the sea, bird watching in coastal areas, whale/dolphin watching, visiting coastal natural reserves, trips to the beaches, seaside and islands, seaside eateries and seafood restaurants Marine commerce Marine financial services, marine legal services, marine insurance, ship finance & related services, charterers, media & publishing Commercial activities and ventures like seaweed farming can create novel economic opportunities in rural communities, improved by the interconnectedness of the global economy. They can also be more environmentally friendly as compared to other aquaculture activities. Part of the reason is that seaweed and other species of algae do not need fertilisers to grow – they just need sunlight, carbon dioxide and water. All these factors show how economic prosperity, trade and the preservation of the environment can, in fact, reinforce each other. In the context of the Paris Agreement, ocean-based economic diversification can enhance the nationally determined contributions of small island developing states, supporting the implementation of the agreement. This shows that trade can be an enabling factor in adaptation and in mainstreaming of ocean-based economic activities, where domestic markets remain small and remoteness is an intractable hindering factor. Source: UNCTAD data From the value of linear shipping connectivity index (LCSI, measure of connectivity to global shipping networks) over 2006 to 2019, it can be observed that connectivity of China is relatively robust followed by USA, Germany, Japan and then India. India has a 7,517 km long coastline along with 14,500 km of potentially navigable waterways and strategic locations along major international maritime trade routes. Still India’s coasts only contribute to 15% of national trade activity. Through its ambitious and flagship Sagarmala project, the Indian government wants to structurally transform the country’s ports and truncate logistics costs for domestic as well as import/export cargo by optimizing infrastructure investment. Achieving the blue economy aspirations would require extensive and arduous cooperation between the requisite stakeholders that include the private sector, scientific and local communities and non-governmental organisations. It would be fruitful to learn lessons, compliance mechanisms and legislative models from other regional bodies such as the Pacific and Caribbean communities. Adapting best practices to the Indian Ocean context would fill the current gap of a strong foundation of regionalism upon which new approaches to fisheries, climate change and food security could be developed. Notes: Countries’ access to world markets depends largely on their transport connectivity, especially as regards regular shipping services for the import and export of manufactured goods. UNCTAD’s Liner Shipping Connectivity Index (LSCI) aims at capturing a country’s level of integration into global liner shipping networks.

“Intra-sector competition has given rise to a large number of NPAs”
In his interaction with TPCI, Mr. Vijay Setia, President, All India Rice Exporters Association (AIREA), talks about how the Indian rice industry is placed on the global landscape, challenges with respect to NTBs, MRLs and trade agreements as well as major potential markets that India is targeting for its rice. TPCI: According to recent reports, the withdrawal of 5% tax rebate earlier meted out to non-basmati rice exports under MEIS has led to the decline of exports. What, in your opinion, should be done to rectify this situation? Mr. Vijay Setia: The export price of non basmati rice is strictly driven by the Minimum Support Price (MSP). During the last Kharif crop of 2018-19, the MSP was Rs 1750/Qtl for coarse rice and Rs 1770/Qtl for superfine rice. The export price with this MSP encroaches the international price and hence our prices become uncompetitive in most markets. The incentive of 5% MEIS, which was granted by Government of India to rice exports during only a short period of about four months last year (November 2018-25th March, 2019) gave a boost to exports since this led to offsetting some part of the cost. This resulted in a jump in exports during these months as compared to earlier periods as shown in table below. But since the incentive of MEIS was withdrawn effective March 26, 2019, the impact has started becoming visible from June onwards when there has been huge drop in exports. While in March 2019, export was 814,922 tonnes; in April, May, June and July, it dropped to 308,175 tonnes, 413,597 tonnes 482,633 tonnes and 502,486 tonnes respectively. India’s rice export trends Months 2017-18 2018-19 2019-20 April 475,050 642,792 308,175 May 547,782 795,322 413,597 June 700,311 587,061 482,633 July 721,802 544,121 502,486 August 782,925 631,020 Sept 720,666 510,601 Oct 636,425 617,488 Nov 643,889 562,737 Dec 732,124 683,284 Jan 650,096 507,148 Feb 737,388 550,918 March 721,867 814,922 Total 8,070,325 7,447,414 1,706,891 Quantity in tonnes As compared to export of non-basmati rice of 25,69,296 tonnes during April-July 2018, the figure has dropped drastically to 16,94,153 tonnes during April-July 2019, reflecting a drop of 34% over previous year. The Government of India must restore the MEIS benefit for rice since it is a major commodity of export in the agriculture basket of India. TPCI: How is the Indian rice industry placed in the global landscape? What is the aspiration that the industry sets for itself in the coming 5-10 years – vis-a-vis export volume/value growth, brand equity, domestic consumption, etc? What is the strategic roadmap that AIREA has set to achieve these aspirations in collaboration with the industry? Mr. Setia: India is the top exporter of rice in the world followed by Thailand, Vietnam, Pakistan and USA. However, the scenario may show a dynamic shift if the current declining trend continues during the current financial year any longer. The industry today is in a dilemma. Though production of rice in India is growing, the industry has been investing hugely in setting up state-of-the-art facilities and there is a great potential to retain the top spot in the global market for India. Yet, the sanitary stringent norms of importing countries, non-availability of incentives from the Government, high logistics costs could play spoilsport in this effort of the industry. As for brands, it is again a very dicey issue since the Government of India imposes GST of 5% on branded rice, which leads to higher cost to brand owners compared to unbranded rice and proves to be a disincentive to branding. AIREA and industry have been working collectively and jointly in efforts to redeem the industry from the clutches of difficulties in external trade. We are regularly trying to educate farmers for the past four years about safe agronomic practices, etc. This bonding will be further strengthened to boost the morale of the industry, which is currently in a depressing state. IBT: What are your views on the impact of trade agreements on India’s rice exports? What should be the desired approach towards future trade agreements, in context of the rice industry? Mr. Setia: The motive and objective of trade agreements is to progressively liberalize and facilitate trade in goods among the parties through, inter alia, progressive elimination of tariff and non-tariff barriers in substantially all trade in goods among the parties. Now, there is a very thin line between tariff and non-tariff barriers today and sanitary issues are actually being used to create NTBs across countries. We feel that in any trade agreement, the basic criteria should be (a) Prominence of the market in regard to Indian rice (b) Revealed Comparative Advance to India in that country (c) Mutual duty concessions and (d) Mutual conformity assessment in regard to sanitary issues and other NTBs. IBT: How are the Indian rice varieties – Basmati & non-Basmati – perceived in the global market vis-a-vis their foreign counterparts? Mr. Setia: Basmati rice is a unique product of India and is also a Geographical Indication (GI). It derives preference from more than 130 countries to which India exports in excess of 4 million tonnes annually. As for non-Basmati rice, the choice of consumers is reflected from the magnitude of business in excess of 7.5 million tonnes to over 130 countries. Credit for this must go to Indian exporters of rice who have left no stone unturned in establishing state-of-the-art facilities in terms of infrastructure, in-house laboratories etc and spent huge amounts on brand building and in turn adhering to stringent trade requirements of the global market. IBT: What are the major potential markets that India is targeting for its rice? How are the efforts to enhance exports panning out in China? Mr. Setia: Western Africa has become a major destination for Indian non-basmati rice in particular over the past few years. Indian exporters are endeavoring to strengthen their presence in these markets. For Basmati rice, Middle East has traditionally been a stronghold area. Iran and Saudi Arabia being prime countries. But the need is to not

India-ASEAN FTA: Ironing out the flaws
• India’s free trade agreement with ASEAN – Indonesia, Thailand, Singapore, Malaysia, Philippines, Vietnam, Myanmar, Brunei, Cambodia and Laos – for goods came into force in 2010 and for services, in 2015. • The FTA has been a matter of distress for Indian goods producers due to surge of imports of various products under the preferential treatment so much that industries are apprehensive about the RCEP agreement also. • The proposed review of the FTA should focus on addressing industry concerns but without taking protectionist measures. • The attention should be on finding ways to enable the industries in ASEAN region and India engage in a win-win manner rather than competing at each other’s’ loss. The ASEAN-India FTA that came into effect in 2010 for goods and 2014 for services, is now expected to be reviewed by both sides to “make it more user-friendly, simple and trade facilitative for businesses”. India’s FTA with ASEAN was an important pillar in India’s “Look East” Policy now rechristened as “Act East Policy”, as the group of 10 nations has a population of 642.1 million people with a GDP of US$ 2765.8 billion (2017). The agreement has not been fruitful for Indian industry, as its trade deficit with ASEAN nations has more than doubled from US$ 5 billion in 2011 to US$ 10 billion in 2017. Expectations from AIFTA – As is for any trade agreement, the motivation behind this FTA was also increased bilateral trade arising from preferential treatment in tariff and non-tariff barriers to trade, enhanced flow of investment from technologically advanced countries like Singapore and Thailand to skilled labor of India and a significant export of services from India into the region. India’s intention behind entering into this FTA was also to engage with the giant group of nations so as to provide a market in the neighborhood for domestic goods and services. Even after considering that ASEAN countries are more competitive in merchandise products, the FTA was expected to yield benefits from India’s competitiveness in services exports, which could also outweigh the possible losses in merchandise trade. Trade scenario India’s exports to ASEAN have increased by 57% between 2010 and 2018 while imports have increased by 93%. Bilateral trade 2009 (before FTA) 2010 FTA came into force 2011 (after FTA) 2018 (current trend) India’s exports to ASEAN 17.899 22.958 34.498 36.074 % share of India’s total exports 13.56% 13.45% 13.38% 17.71% India’s imports from ASEAN 23.968 29.640 40.332 57.210 % share of India’s total imports 9.00% 8.47% 8.72% 11.27% Source: ITC Trade Map; Values in US$ billion Between 2010 and 2018, among ASEAN countries, India’s exports have increased most in case of Myanmar – US$ 0.27 bn to US$ 1.23 bn, Vietnam – US$ 2.47 bn to US$ 6.7 bn, Malaysia – US$ 3.5 bn to US$ 6.5 bn, Thailand – US$ 2.1 bn to US$ 4.3 bn. In case of India’s imports from ASEAN, the growth has outpaced the growth in exports. Between 2010 and 2018, imports from Vietnam increased from US$ 0.99 bn to US$ 7.21 bn, Indonesia – US$ 9.69 bn to US$ 16.02 bn, Malaysia – US$ 5.99 bn to 10.41 bn, Thailand – US$ 3.94 bn to US$ 7.66 bn, Singapore – US$ 7.26 bn to US$ 14.32 bn. However, it is to be noted that India has Bilateral engagements with Singapore, Malaysia and Thailand and that increase in trade, especially imports, is a result of dual preferences. What demands more concern is that nations these three countries along with others have been able to increase their exports to India utilizing the free trade agreements – AIFTA and bilateral – but Indian industries have not been able to penetrate these markets under the same preferences. Top products of exports to ASEAN are petroleum oil, bovine meat, p-xylene, shrimps, diamonds (worked), medicaments, aluminum, cotton etc. while top products of imports include coal, palm oil, copper wires, crude petroleum, rubber, parts of telephone sets etc. Major beneficiaries in India’s exports to ASEAN are shrimps, light oils and preparations of petroleum, cuttle fish and squid, cumin seeds, compression-ignition internal combustion piston engine, medium oils and preparations of petroleum, meat of bovine animals and many others. Top products of import by India from ASEAN Product code Product label India’s imports from Association of South-East Asian Nations (ASEAN) 2010 2018 270119 Coal, whether or not pulverised, non-agglomerated (excluding anthracite and bituminous coal) 2897.523 6788.521 151110 Crude palm oil 3639.11 3986.733 270900 Petroleum oils and oils obtained from bituminous minerals, crude 1557.191 2868.275 851762 Machines for reception, conversion and transmission or regeneration of voice 115.778 2162.086 151190 Palm oil and its fractions, whether or not refined (excluding chemically modified and crude) 838.701 1471.391 740819 Wire of refined copper, with a maximum cross-sectional dimension of <= 6 mm 9.377 1029.441 851770 Parts of telephone sets, telephones for cellular networks or for other wireless networks 288.268 854.618 271019 Medium oils and preparations, of petroleum or bituminous minerals, not containing biodiesel 1795.763 800.348 847150 Processing units for automatic data-processing machines 210.929 678.61 400122 Technically specified natural rubber “TSNR” 263.715 672.145 Top products of export by India to ASEAN Product code Product label India’s exports to Association of South-East Asian Nations (ASEAN) 2010 2018 271019 Medium oils and preparations, of petroleum or bituminous minerals 3147.869 7647.449 20230 Frozen, boneless meat of bovine animals 638.315 2481.203 271012 Light oils and preparations, of petroleum or bituminous minerals which >= 90% by volume 0 1642.329 760110 Aluminium, not alloyed, unwrought 305.884 983.165 290243 P-Xylene 292.837 951.968 30617 Frozen shrimps and prawns, even smoked, whether in shell or not, incl. shrimps and prawns 0 856.289 710239 Diamonds, worked, but not mounted or set (excluding industrial diamonds) 518.636 663.749 300490 Medicaments consisting of mixed or unmixed products for therapeutic or prophylactic purposes 176.859 562.448 520100 Cotton, neither carded nor combed 313.878 534.741 711319 Articles of jewellery and parts thereof, of precious metal other than silver 281.854 423.923 Source: ITC Trade Map, values in US$ million Source: Trade Map ITC

Product Profile: Saffron
HS CODE: 091020 • World exports of saffron escalated at a CAGR of 14.55% from 2014-2018 in value terms indicating a massive increase in global demand. • The Islamic Republic of Iran produces more than 90% of the world’s saffron and accounts for 70% of global exports. • A number of prestigious re-exporters such as Spain, France and Italy add value to Iranian bulk imports and resell the saffron at a higher price. • After the Islamic Republic of Iran, India ranks as the second-largest producer of saffron, with the spice cultivated primarily in the Kashmir region. But as a saffron exporter, India is ranked twelfth among global saffron exporters. Saffron is one of the world’s most distinguished and rare agricultural products cultivated as a source of spice for at least 3,500 years. The name ‘saffron’ is a derivative of the Arabic “zá-faran”, which means ‘be yellow’. Saffron is heavily demanded by consumers due to its application in the food and beverage industry, which is anticipated to be a significant factor driving growth of the global saffron market. In food, saffron is used as a flavouring agent, spice and yellow food coloring, which makes it one of the most preferred spices for consumers. Apart from that, saffron is also used as a dye, spice, fragrance and for medicinal purposes. One stigma of saffron weighs about 2 mg and on an average each flower has three stigmata, so near about 150,000 flowers must be picked one-by-one in order to produce 1 kg of the spice. Saffron, unsurprisingly, is one of the world’s most expensive spices, and when it intersects with global politics it also lends itself to a fascinating history of underground trade. The main value of the world’s saffron harvest is captured by re-exporters in countries such as Spain, France and Italy, who have sophisticated, well-established packaging methods and distribution channels. The latter applies as well to the Islamic Republic of Iran, maintains well-established trade networks. For emerging producer nations such as Afghanistan, it remains a challenge to find a niche in the market independent of the existing distribution channels controlled by re-exporters. Saffron is currently being cultivated in Iran, India, Afghanistan, Spain, Greece Italy, Turkey, France, Switzerland, Israel, Azerbaijan, China, Egypt, UAE, Japan, Iraq and recently Australia (Tasmania). The world’s total production of dried saffron is estimated to be around 325 tonnes a year. Iran produces more than 90% of the world’s total production of saffron. More than 92% of Iranian saffron is cultivated in Khorasan province. In India, saffron is exclusively cultivated in Jammu & Kashmir until now. Some instances of saffron cultivation have been reported recently in Himachal Pradesh and Uttarakhand. One of the world’s most expensive spices by weight, saffron is globally sold in grams. Iran is the leading saffron exporter earning revenue of US$ 51million. Spain and India are the major importers of Iranian saffron. India’s saffron consumption is estimated at 20 tonnes a year, half of which is met by leading producers – Iran, Spain and China. Top exporters of saffron Economies Value in US$ million Annual growth of exports from 2014-2018 (%) World 491.915 12 Iran 351.12 15 Spain 54.57 7 Afghanistan 42.46 85 Hong Kong, China 6.20 178 France 4.47 -6 Source: ITC Trade Map Top importers of saffron Economies Value in US$ million Annual growth of imports from 2014-2018 (%) World 358.94 17 Hong Kong, China 99.17 169 Viet Nam 53.76 7 Spain 35.90 85 UAE 21.20 178 India 18.30 -6 Source: ITC Trade Map, 2019 World exports of saffron escalated at a CAGR of 14.55% from 2014-2018 in value terms, indicating a massive increase in global demand. Source: ITC Trade Map After the Islamic Republic of Iran, India ranks as the second-largest producer of saffron, with the spice cultivated primarily in the Kashmir region. As a saffron exporter, though, India’s performance is less commanding; it is only ranked twelfth among global saffron exporters. With a spice loving population that tops 1 billion, India’s impressive production levels are still insufficient to meet domestic demand. To satisfy this demand, US$ 18.3 million in saffron was imported to India in 2018, making it the world’s fourth-largest importer. This indicates that India predominantly imports for consumption and not for re-exporting, unlike other major saffron exporters. Government of India set up SPEDA (Saffron Production and Export Development Agency) in 2015 to promote production and export-related activities related to saffron. Kashmir, one of the only four producers of saffron in the world, barely consumes a fraction of what it produces. Most of its output goes to the plains with exports of just about four tonnes. Local brands are largely present in India and there is absence of large international/national brands. There is an opportunity for developing a nationwide brand of saffron. Besides, this is a nation where a burgeoning middle class is now craving for a wide range of products with health benefits, which is a big driver for increase in consumption.

India’s foreign trade: Need for speed & sustainability
• India’s export growth slipped for the second time in three months, while the imports continued to decline for the third straight month. • The export stimulus package announced by the government will surely a great breather in near term as it will immediately address working capital demand and inefficiencies in the system, making the refund of input credit seamless. • The new scheme, Remission of Duties or Taxes on Export Product (RoDTEP), which replaces MEIS, will need immediate clarity on its details • Industry is looking for more long terms structural interventions like time bound adoption of necessary technical standards, modern clusters, market-led trade strategy and branding support. Exports are recognised as a key driver in India’s ambitions to be a US$ 5 trillion economy. Shri Piyush Goyal, Minister for Commerce & Industry, asserted last week, “India must bring back 19-20% export growth to become a $5 trillion economy”. However, India’s exports in the current fiscal seem to be largely mirroring the gloomy sentiment prevalent across the global economy. In August, India’s merchandise exports fell by 6% YoY to reach US$ 26.13 billion. Imports declined by 13.45% YoY to reach US$ 39.6 billion, implying a reduced trade deficit of US$ 13.45 billion. The drop in the trade deficit would otherwise be cause for celebration, but for the implied sluggishness in domestic demand. More than 20 sectors out of 30 have registered negative growth, including oil and gold imports. Smt Nirmala Sitharaman, Minister of Finance has introduced a stimulus package to boost India’s exports. This includes, most importantly, the introduction of a new scheme for remission of duties and taxes on export product (RoDTEP) to replace the current Merchandise Exports from India Scheme (MEIS) from January 1, 2020 and revision of priority sector lending norms, which will release an extra Rs 36,000 crore to Rs 68,000 crore as export credit. Mr Mohit Singla, Chairman, Trade Promotion Council of India, commented on the government measures, “Exports stimulus package will surely be a great breather in near term as it will immediately address the working capital demand as well as inefficiencies and delay in the system; making the refund of input credit seamless. This is a clear indication of government intend to help the industry. Also, priority sector lending for the export sector is a great breather. The thrust on digitization will cut the transportation and shipment time and goods will be cleared faster.” However, he added that the new scheme RoDTEP “will need immediate clarity on its details, on how it will incentivise exporters”. Further, he added, “The industry is looking for more long terms structural interventions like time bound adoption of necessary mandatory technical standards to overcome technical barriers and affordable testing and certification infrastructure. Of late, the trade war has aggravated and frictions to bilateral trade have grown at global scale. These long term measures will make Indian export competitive globally.” Following are the measures that TPCI recommends for long term sustainability; Identifying the most promising sectors – Promote and produce competitive products in which the country has a distinctive advantage. India should try and produce what it is good at and at the best possible prices so that people are inclined to buy and the product is competitive globally. Also, the focus should now be on exporting more finished products rather than raw materials, to counter many tariff and non- tariff barriers. Creating modern clusters – It is time when India needs to phase out subsidies and boost competitiveness basis the strength of the product. This can only be achieved by mass production and achieving economies of scale. The problem is that we do not have the productive capacity. The idea of cluster is to generate a sense of cooperative manufacturing and start building capacities together and leveraging capacities of each other. The shared utilities will have much lesser cost and help produce goods at minimum input cost. The need of the hour is creating clusters based on specific products like furniture, food processing and electrical with sunset window and other tax benefits to create a mega ecosystem, where investments can generate guaranteed returns. Need for national shipping line- Indian exporters are facing severe problem due to continuous rise in shipping freight to US, Canada and even to European markets by the shipping lines. These increases have been brought about by imposing several surcharges like peak season surcharge and general rate increase which varies according to different shipping lines and container sizes. Apart from these, the shipping lines have also imposed several small surcharges and incidental charges such as the issuance of Bill of Lading (BL), Amendment to BL and various other smaller charges, which are adding up to a sizeable amount. In the absence of a National Shipping Line, our exporters are at the mercy of these foreign shipping lines. Encourage exports of GIs – India has over 300 GIs registered, but few have been used for commercial value addition. Two of India’s well-known GIs are Darjeeling tea and Basmati rice. Branding agri-products in particular through steps such as geographical indication (GI), especially for organically-produced commodities, would realize higher returns in global markets. New SEZ policy needed – SEZs have to create compelling reasons so that people invest in SEZ region for the initial catalyzing effect. An idea is to incentivize the exporter on degree of value addition. An exporter should be allowed to import raw material at zero duty and avail duty rebate proportionate to value addition. A market-led trade strategy- An intensive and focussed market promotion effort targeting key identified countries has been lacking. The government should promote a sales office, which is an established global practice. Trade bodies can run these offices at their own cost to promote trade. The government may incentivize them throughout on any increase in exports to a dedicated region, purely based on performance. Branding – Branding is very important to obtain recognition and acceptance in the global markets. Helping the new and existing exporters in promoting their brands and

Global Agricultural Prices: Can history repeat itself?
• Average FAO food price index averaged 169.8 points in August 2019, plummeting by almost 2 points from July (1.1%). • Since agricultural products have relatively inelastic demand, a price decline reduces the revenue and value of trade. • Around 72% of the measures aimed at removing export restrictions and taxes after 2012 were applied to the same commodities, as their prices experienced a steep decline. • In times of low prices, supporting agriculture and providing subsidies might result in significant externalities by further depressing international prices and exporting volatility onto world markets, largely at the expense of smaller countries. The average FAO food price index (FFPI) averaged 169.8 points in August 2019, plummeting by almost 2 points from July (1.1%). The decline in August marked the third consecutive monthly decrease in the FFPI. The latest drop reflected sharp falls in the prices of sugar and leading cereals, outweighing increases in all other sub-indices, especially vegetable oils. There are five categories, which represent FFPI including cereals, vegetable oils, meat, dairy and sugar. Out of these five, cereals have experienced maximum decline in terms of deflated monthly and annual price index. The weights used for the commodity sub-indices are: Cereals Dairy Meat Vegetable oils Sugar 0.272 0.173 0.348 0.135 0.072 Source: FAO Food Price Index Now the question is, how will global agricultural trade will be moving in coming time frame? Knowing the implications of the trade war, US-Iran tensions, currency war, protectionist wave and major currencies plummeting, it seems a daunting scenario for agricultural trade to flourish and proliferate. This becomes more specific for primary agriculture exporting economies like India. In times of low prices, domestic pressures are more likely to come from producers concerned about remunerative prices and the need to maintain farm income. Since agricultural products have inelastic demand, a price decline reduces the revenue and value of trade. Source: FAO food price index, 2019 Compared to similar situations prevailing in earlier periods of low prices such as the 1980s and 1990s, the most prominent development is the rise of emerging economies such as China, India and Indonesia. As these countries accumulate enough resources with which to support agriculture, they might be tempted to follow the path of OECD countries that have traditionally been the main providers of trade-distorting subsidies and border protection. In times of low prices, such policies might result in significant externalities by further depressing international prices and exporting volatility onto world markets, largely at the expense of smaller countries that cannot afford to provide such income support to their farmers in these times. The lower value of exports can be explained by the fact that India’s export basket consists mainly of low-value and semi-processed commodities such as rice, wheat and marine products. Further, around 76% of exports are primary, those that undergo minimal processing such as cleaning, sorting, refrigerating and converting paddy into rice. In recent years, their share has undergone a 4% increase on account of exports of live animals, bovine meat, frozen fish, crustaceans, cereals, flour, groundnut seed, soybean seed and meal, onion, tea, and spices. The remaining 20% share is of processed and value-added products, which entail extensive processing of both raw and semi-processed commodities, such as processing of barley to produce beer or making cheese from milk or seed to edible oil. There is little increase in their share, even though the export basket has, of late, slightly diversified towards chocolates, wafers, sweet biscuits, preserved edible fruits and nuts, mixed seasoning and sauces, ice-cream, and meals and pellets for fish. In a way, it reflects a growing competitiveness of Indian agriculture, but largely in low-value primary produce. The estimated revealed comparative advantage (RCA) index also shows much higher values for primary products compared to the processed and value-added ones. The main value-added products that are competitive in the world markets are sugar in solid form, extracts and essence of tea and coffee, oilcakes, manufactured tobacco, and preserved fruits and vegetables. This cogently indicates that the food and beverage industries lack cost-competitiveness and, hence, India may find it difficult to meet the stated export targets. The Indian industry has to compete with major global players, including China, EU, Australia, US and Canada. Presuming that it is able to bring in better technology and resource-use efficiency to compete in the export markets, non-tariff measures imposed by other countries would act as deterrent. So far, however, WTO negotiations aimed at truncating trade-distorting agricultural subsidies have progressed slowly, with limited prospects of a solution in the short term. Falling prices with successive reforms of domestic support and the move away from price support mechanisms, have resulted in large gaps between applied levels of domestic support in the EU and US and their maximum entitlement under WTO rules. Similarly, on market access, developing countries like India and most African countries have consolidated their tariffs at fairly high levels after the Uruguay Round. In a similar vein, WTO members might also find that the tendency towards falling prices makes it easier to reach agreements on new rules in other areas, such as reducing the impact of agricultural export restrictions on consumers in poor, food-importing countries. Especially if food price spikes recur in the years ahead, action in this area could help ensure that poor consumers are able to access food even if global markets become more volatile. In the past, export restrictions actually declined slightly, while trade-liberalizing export measures experienced significant growth. Indeed 72% of the measures aimed at removing export restrictions and taxes after 2012 were applied to those same commodities, as their prices experienced a steep decline. A similar approach to policy may be expected if FFPI continues to decline.

Country Profile: France
• GDP of France is US$ 3.05 trillion with services sector contributing more than 75% to its GDP • France’s primary exports are machinery and transportation equipment, aerospace equipment and plastics, while primary imports include machinery, automobiles and crude oil. • India-France bilateral trade figure stood at US$ 8.86 billion in 2018 which grew by 5.05% in past three years. • Both countries have shared strategic interests and fairly common worldview, with growing cooperation in areas like renewable energy, nuclear power, defence cooperation and cyber security. France’s economy is the fifth largest in the world and represents around one fifth of the Euro area in terms of gross domestic product (GDP). France is a large country in Europe, which shares its border with both the Mediterranean Sea and the Atlantic Ocean. Currently, services are the main contributor to the country’s economy, with over 75% of France’s GDP stemming from this sector. In manufacturing, France is one of the global leaders in the aerospace, automotive and railway sectors as well as in cosmetics and luxury goods. Furthermore, France has a highly educated labour force and the highest number of science graduates per thousand workers in Europe. France’s unemployment rate dipped slightly in the second quarter to 8.5%, its lowest level in a decade. Fiscal policy needs to address this worrying issue which is currently enervating French economy modestly. Kaleidoscopic Glimpse of France • More than 350 kinds of cheese are made in France • France is famous for cheese (Camembert, Brie, Roquefort) wine, perfume (Chanel, Dior, Givenchy) and cars (Renault, Citroen, Peugeot). • France is also famous for the Tour de France and the Eiffel. • Symbols such as the Eiffel Tower, the Louvre, the Cathedral of Notre Dame, the Latin Quarter, Montmartre, and the Georges Pompidou Centre make Paris one of the most visited places in the world. • France’s highest mountain ranges are the French Alps and Jura Mountains, bordering Italy and Switzerland, and the Pyrénées, along the frontier with Spain. • The highest mountain is Mont Blanc in the French Alps. It rises to 4,807m (15,771 ft). Mount Blanc is also the highest peak in the whole of Europe. Macroeconomic Outlook of France Population of France 67.1 million GDP per capita US$ 46,887 GDP US$ 3.05 trillion GDP growth rate 1.3% in 2019 Unemployment 8.8% Gini coefficient for income inequality 29.30% Inflation 1.35% GDP by sector (Agriculture, Industry & Service) 1.7%, 19.5% and 78.8% respectively The economy has been growing sluggishly this year as lacklustre growth across the Eurozone, protracted Brexit-related anxieties, high unemployment rate and global trade tensions hit the external sector. That said, household spending should cushion the slowdown, as tax cuts and a tighter labor market boost consumers’ purchasing power. Fiscal slippage remains a concern, however. Analysts see growth at around 1.3% this year, which is unchanged from last month’s forecast, and at 1.3% again next year. In the external sector, France’s largest trading partner is Germany, which accounts for more than 17% of France’s exports and 19% of total imports. France’s primary exports are machinery and transportation equipment, aerospace equipment and plastics, while primary imports include machinery, automobiles and crude oil. Additionally, France is the most visited country in the world, making tourism a prominent sector in the economy. Other key exported services include business services and transportation France has an export-to-GDP ratio of close to 30%. The country’s highest goods exports in terms of dollar value include machinery, aircraft and spacecraft, vehicles, electronic equipment and pharmaceutical products. France is also one of the world’s largest exporters of farm and agricultural products and is popular for its wine, spirits and cheeses. The French government provides significant subsidies to this sector and France is the largest exporter of farm products in Europe. Trade Flows of France Source: ITC Trade Map A majority of France’s exports are to European nations, with only around one-third of all exports going to economies outside Europe. France exports the largest amount of goods and services to Germany, followed by Spain, Italy, Belgium, and the UK. Outside of the European Union, US is the largest destination for French exports. Trade basket of France Exports of France, in US$ billion Imports of France, in US$ billion Total 568.44 Total 658.95 Machinery and mechanical appliances 67.69 Machinery and mechanical appliances 83.65 Automobiles 56.58 Automobiles 73.94 Air crafts and space crafts 51.89 Mineral oils and petroleum products 73.74 Electronic products 44.85 Electronic products 58.13 Pharmaceutical products 33.81 Plastics and articles 26.96 Plastics and articles 22.50 Pharmaceutical products 25.12 Essential oils and perfumery 19.69 Aircrafts and space crafts 21.52 Beverages, spirits and vinegar 19.38 Optical and medical instruments 19.49 Mineral oils and petroleum products 18.69 Organic chemicals 16.43 Optical and medical instruments 16.91 Articles of iron or steel 12.56 Source: ITC Trade Map, 2019 Export and Import Partners of France Top importing partners of France Top exporting partners of France Germany 102.34 Germany 83.28 China 58.89 USA 45.28 Italy 50.36 Spain 44.33 Belgium 46.37 Italy 42.80 Spain 42.87 Belgium 40.35 Source: ITC Trade Map, 2019 India-France: Trade & Investment Source: ITC Trade Map India-France bilateral trade figure stood at US$ 8.86 billion in 2018, which has grown by 5.05% in the past three years. Major products India exported to France included prepared petroleum products, parts of aircrafts, pharmaceuticals, garments, footwear, accessories of automobiles, insecticides, optical fibres and static convertors. On the other hand, Indian imports from France includes petroleum gas and hydrocarbons, powered helicopters and aeroplanes, human and animal blood, turbojets, turbopropellers, monitors and projectors, telephone sets etc. France has emerged as a major source of FDI for India with more than 1,000 French establishments already present in India. France is the 9th largest foreign investor in India with a cumulative investment of US$ 6.76 billion from April 2000 to June 2019, which represents 1.55% of the total FDI inflows into India, according to statistics provided by the DPIIT. The highest FDI equity inflows are in the services sector (19.30%), with cement & gypsum

Bananas: Keeping the dreaded TR4 disease at bay
• Bananas are the staple in many parts of the world because of their high nutritional value. • India is the leading producer of bananas, but the Latin American region is the largest exporter of the fruit. • A fungal disease called Panama wilt or TR4 has gripped the major exported variety of Cavendish bananas, posing a major threat to the crop. • With its rich portfolio of banana varieties, India can take the lead in developing new, disease-resistant cultivars to combat this menace. Bananas originated in Malaysia 4,000 years ago, are rich in vitamin B6 and C, manganese, potassium, dietary fiber, potassium, biotin, and copper. From Malaysia, bananas spread to India and the Philippines and further to the Americas. According to FAO, the world’s total production of bananas was 114 million tonnes in 2017, led by Asia, North & South America and Africa. India is the leading producer with an average production of 29 million tonnes per year between 2010 and 2017 – a fourth of global production – followed by China with average annual production of 11 million tonnes, Philippines with an annual average of 7.5 million tonnes and Ecuador and Brazil at 7 million tonnes each. Philippines is the largest consumer with per capita consumption of 60 kg/year. Banana provides 25% of the daily calorie intake in countries like Uganda, Rwanda and Cameroon, where per capita consumption exceeds 200 kg of bananas including plantains, according to FAO. In least-developed economies, bananas as a staple provide food security because of high nutritional value and are also a source of income generation as a cash crop. As per the Ministry of Agriculture’s Horticultural Statistics at a Glance 2018, India’s area under cultivation of bananas has remained around 0.8 million hectares, while production has increased from 29.13 million MT in 2015-16 to 30.8 million MT in 2017-18. Major banana producing areas in India lie in the states of Tamil Nadu, Andhra Pradesh, Maharashtra, Gujarat and Karnataka. In 2017-18, only 101,314.37 MT of bananas were exported by India out of the 30.8 million MT production. It indicates that India’s production of bananas is consumed domestically only. Major banana exporters in the world originate in the Latin American region. These countries produce the Cavendish variety of bananas, which is more durable during shipping as compared to others. Ecuador, Philippines, Guatemala, Costa Rica and Belgium are the top exporters of bananas (2018) while US, Russia, Belgium, China and Germany are the top importers of bananas (excluding plantains). India’s exports of the product mainly go to countries (in terms of quantities) like Nepal, Oman, Iran, UAE, Iraq, Saudi Arabia, Afghanistan, Qatar and Kuwait- mainly in the Middle East and Asia. The main reason for this is the transportation time to other destinations, which makes exports unfeasible due to the perishable properties of the product. There are no imports of banana into India. Bananas racing towards extinction? Of late, the sector faces a daunting challenge in the form of the infamous Tropical Race 4 (TR4) of the Fusarium wilt fungus. This has been a serious threat affecting banana production in Asia. Once the disease affects the crops, it can’t be treated. TR4 is a soil pathogen first discovered in the 1990s in Malaysia and Indonesia, which spread quickly to China. Production in Indonesia, Australia, Malaysia and the Philippines has also been severely affected by TR4, posing a threat to the livelihoods of banana farmers. The disease mainly affects the Cavendish variety of banana, which is known for its durability in shipping. The disease has already started impacting the Latin American plantations especially in Colombia. The major issue is that the Cavendish variety accounts for around 97% of global exports. Therefore, this new strain of Fusarium threatens to wipe out virtually all of the global banana trade. The disease spreads fast, through infected plant material and soil particles attached to vehicles and farm equipment, as well as through irrigation, drainage water and floods. According to reports, no other varieties of banana are available for cultivation on this large a scale. In India, in the last few years, the same disease has quietly gripped the crop in eastern UP as well as Bihar destroying the crop to a large extent. However, the Central Institute of Subtropical Horticulture (CISH) has come up with a bio-formulant to save banana crops from fungal infection. This formula can be savior for families and industries that depend on bananas for their food and living as the TR4 disease is virtually ineradicable. One benefit for India in this imbroglio has been that it produces many more varieties of banana. As per reports, there are over 300 varieties of bananas cultivated in India, and susceptibility to wilt disease is not uniform. For instance, Nendran and Red banana have been found to be resistant to race 1 infections. However, even in India, Cavendish bananas have increased their share to 55-60% of land under cultivation and 65% of production, so urgent measures need to be taken. These could include quarantining farms and blocking exit of infected plants and material from the fields. Disease free planting material will have to be deployed and personnel need to be trained on controlling the spread of the problem. If this disease spreads, it can lead to major crop losses and unemployment for farmers, compelling them to shift to more non-remunerative crops for survival. Moreover, once it infects the soil, TR4 is expected to stay in it for 30 years. In the long run, India should adopt sustainable measures like planting of resistant cultivars and identification of botanicals and antagonist microbes. Given its rich and diverse culture of banana cultivation, India has the potential to develop more resistant varieties. For instance, while numerous varieties are showing the impact, the National Research Centre for Banana asserts that the Nendran Banana from Kerala (which has a GI tag) is not susceptible to TR4. Scientists from the institute have also found some wild species and traditional bananas that are resistant to the wilt. These

Indian leather exports: Can the industry keep its best foot forward?
• Home to 20% of the world’s cattle and buffalo, and 11% of the world’s goat and sheep population, India is a favourable destination for the leather industry. • The industry is among the top ten foreign exchange earners for the country and employs around 4 million people. • The government is planning a reduction in export duty of raw leather and hide from 60% to 40%, which is facing opposition from the leather sector due to potential shortage. • Measures like capacity building, setting up of a leather zone cluster, connecting to global value chains and impetus to innovation & brand building will help boost value added exports. The leather industry in India is among the top ten foreign exchange earners for the country, with US (15.70%), Germany (11.58%), UK (10.5%), Italy (6.48%) & France (5.68%) being the major destinations for exports of leather articles in Apr-Mar 2018-19. India is home to 20% of the world’s cattle and buffalo, and 11% of the world’s goat and sheep population, according to Council for Leather Exports. The industry provides employment to around 4 million people, producing around 12.9% of the world’s leather production of hides and skins, and 9% of global footwear. However, the advantage of being endowed with a bounty of raw materials might be negated if the government goes ahead with plans to cut the export duty on raw leather and hide from 60% to 40%. As confirmed by the Economic Survey 2016-17, there is a limited availability of cattle for slaughter in India. Incentivising raw material exports will be detrimental to the industry. As per a notification by the Council for Leather Exports, total exports of finished leather, leather products and footwear from India reached US$ 5.74 billion in 2017-18, but import of raw hides , skins and leathers was only at US$ 0.6 billion for the year. “If the leather goods industry does not get raw materials, how will it survive and proliferate? Every country preserves its raw material resources, especially in sectors, which are competitive, organised and growing, such as leather in India. Yet, the finance ministry has proposed the export duty cut on hide, which defies logic,” believes Puran Dawar, Chairman, Council for Leather Exports (CLE) Northern Region. This could result in the shutting down of many factories, and have a negative impact on the entire chain of production from tanning to finished goods, as raw material supply gets constrained, thereby making finished leather goods from India uncompetitive. Already, the industry’s share of exports has declined in the recent times due to the falling demand for leather in the apparel and footwear industries, especially in the European and Chinese markets, which are major export destinations. Due to awareness of global warming and better scope of designs in synthetic products, many countries are switching to alternatives like synthetic footwear. Tough competition from Bangladesh, Vietnam & Malaysia has also influenced India’s leather exports in an unfavourable manner. India loses out to Bangladesh, for instance, due to the preferential market access for the latter in major exports destinations like the European Union. Further, the sector’s growth in India is impeded by challenges related to logistics, labour regulations, tax and tariff policy. Unlike its competitors, India is handicapped in terms of the time & costs involved in getting goods transported from the factory to the market. Regulations on minimum overtime pay, de facto taxes for low-paid workers& the lack of flexibility in part-time work also bring down India’s competitive edge of having cheap labour. In order to give an impetus to India’s leather industry, the government needs to draw inspiration from its international counterparts. For instance, Vietnam’s footwear industry, which ranks 4th internationally, exports up to 90% of its output. Establishing relationships among local and international footwear manufacturers has been instrumental in raising footwear exports. What helped Vietnam capture European markets is the presence of China, Taipei and the Republic of Korea as its new intermediaries. This enhanced its production capabilities and organized the supply of all required inputs. If we look at Malaysia, it has progressed due to the existence of an experienced and skilled workforce that is equipped with both technical and practical skills apart from efforts towards innovation and brand creation. Export promotion initiatives by the government, coupled with the push for greater innovation and brand creation among the local players, too, have complemented this process. On the domestic front, the government should invest in developing a robust infrastructural network and impart vital skills to the workforce employed in the sector. Setting up a leather zone cluster will also help streamline the production process by providing a pool of common facilities and supply and support services. Loosening of purses by Indian banks would give an impetus to the credit starved startups in this sector. Capacity building through establishing more leather technology institutions having knowledge about cutting-edge technologies will also be necessary to boost the sector. In this regard, the government’s special package of Rs. 2,600 crore for the leather industry is expected to provide employment for about 2.8 lakh people through training by FDDI and other approved training organisations over 2 years and could even help achieve annual export growth of 8-9%. However, the industry also asserts that continuation of the export duty of 60% on buffalo hides is essential to achieve the vision of US$ 10.6 billion of leather exports by 2024-25.