

Unique Fragrances is a manufacturer cum merchant exporter of Indian grocery, spices & general items, to cater to the tastes of their customers. The company specializes in exporting handpicked, clean and sifted spices in consumer packs as per the requirement of its customers. By building and strengthening its associations with second and third generation migrants and participating in various trade shows, the company has successfully penetrated markets like the US, Canada, Australia and New Zealand. Rajat Luthra, Director of Unique Fragrances, speaks in his exclusive interaction with TPCI about the company’s journey from being a leading tobacco exporter to an exporter of spices. He also shares his thoughts on the key challenges faced by the sector, India’s perennial strengths as a spice exporter and the importance of raising awareness about the benefits of spices, as detailed in India’s ancient texts. TPCI: How did you come up with the idea of starting a business in this line? Mr. Rajat Luthra (RL): My father Sh. Deepak Luthra, started this business of exports of Indian groceries & tobacco products. When I entered into this venture in 2003, it was difficult to differentiate ourselves from the other exporters of the market. That was a time when I thought that we should manufacture/process some product which differentiates us from the others. On a meeting with one of our clients in USA, I found that most of the importers are facing difficulties in importing spices due to adulteration, & premium whole spices were in scarcity. From there on we started exports of premium, clean, sterilized and handpicked whole spices. TPCI: What were the initial challenges you faced, and how did you overcome them? RL: Initially when we approached our clients with these premium spices, our prices were way too high in comparison with the prices of other exporters. The second big challenge was procuring good quality clear packaging as the packaging industries in India was still developing. Last, but not the least, talking to these foreign buyers was difficult as internet had not penetrated so much. Hence, finding good buyer was a big task for us. TPCI: Which markets did you tap for your product and why? What market penetration/promotion strategy did you follow? RL: The Indian/Asian migrants to USA, Canada, Australia and New Zealand had settled there since long. Their second and third generations were in business; hence these young entrepreneurs understood the effects of the quality products. I used to travel to these countries calling to the clients and assuring them of quality spices, turning them into our permanent customers. We also exhibited our products through exhibitions promoted by Government bodies like Spice Board of India, APEDA etc. Recently, since the start of digital world, we have also started digital marketing which has increased the number of leads we get every month. TPCI: Who are your key competitor countries, and what unique competitive advantages have helped you establish your business presence? RL: In spices, the major competitor countries are Vietnam, Sri Lanka and Indonesia. But in packed spices, Pakistan & UAE are also making their mark due to the tax benefits and subsidies given by their respective governments. The advantages of India are: a. Availability of almost all the spices, and that India being considered as a one stop shop for spices all over the world. b. Our better understanding of the spice consumer all over the world. To stay ahead of the competition we made several changes in the infrastructure to clean, grade and sterilise the most premium spices that go through all the tests in our in house testing labs. We did extensive market research on consumer surveys to understand the requirements of the consumers. The digital marketing helped us foresee their thoughts, why consumer chooses a particular brand of spices. We, being a technology driven company, have invested heavily in most modern machinery to clean, grade, de stone, remove impurities, sterilize and grind in cool conditions in order to achieve the best of aroma in the spices. The consistency in our spices has also helped us built the confidence in our consumers. TPCI: What are the major tariff/non-tariff barriers that you have experienced in the international markets? What should be the roadmap to overcome these challenges? RL: There are a few barriers but we have overcome the challenges and they do not deter us. The barriers we face are as follows: a. Almost all the African countries impose higher import duties on Indian products whereas there is practically NIL duty from Middle East, this is where the spices manufactures of Pakistan get the advantage. b. Although we have SEZs set up by the Indian Government but those exporters who are located in remote villages/towns do not get the benefit of importing wholesale spices from other countries, cleaning and processing & then re-exporting. c. The Government of India should help these exporters to process and re-export the spices by making the laws governing duties simpler and more efficient. This will benefit our country with inflow of foreign currency. TPCI: What are the expansion opportunities you envision for yourself in the global market at present? How do you plan to tap them further? RL: The market potential is huge. There are buyers of quality Indian spices and we are growing at a rapid pace. As Indian food is liked all over the world, there are many untapped countries which we have to reach for quality spices. Exhibiting our products worldwide and then tapping these consumers through digital marketing seems to be a good way of going forward. Availability of latest technology and its import at lower duty rates shall bring in more opportunities for Indian exporters to supply good quality Indian spices. TPCI: What is your view on the general competitiveness of Indian exporters in this sector? How can it be further enhanced? RL: Earlier most of the Indian exporters were competing with each other on price sensitivity but we need to understand the consumer needs and their eagerness to buy good
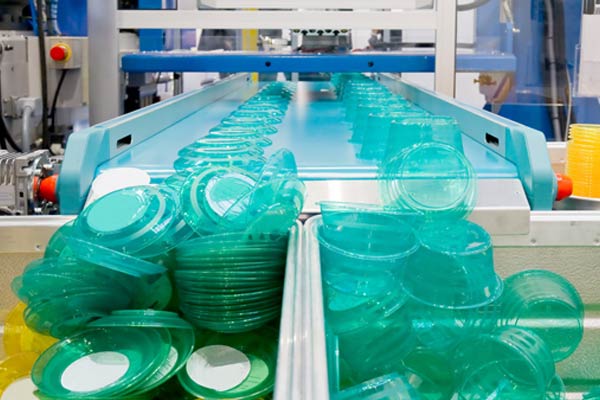
Plastic Industry: Victimized by the war on SUPs?
• The Government of India has indicated that it will follow a stringent policy framework in order to end the country’s reliance on single-use plastics (SUPs). • While this seems to be a great idea to mitigate pollution, it seems highly challenging to replace SUPs at a time when their use has become deeply entrenched in any common man’s life. • Also, paradoxically enough, the total environmental footprint of plastic is actually much lower than that of alternatives! • Public policy should therefore focus on encouraging the industry to produce reusable designs and educating the people on the importance of reuse. Addressing the 14th Conference of Parties of the United Nations Convention to Combat Desertification, Prime Minister Narendra Modi opined “I believe the time has come for even the world to say goodbye to single-use plastic.” Ahead of the 150th birth anniversary of Mahatma Gandhi, expectations are rife that the government, in its war against pollution, is all set to announce measures to reduce plastic use to keep its resolution in the UN Environment Assembly meeting held in Nairobi, to phase out Single-use plastics (SUPs) by 2025. Mr Modi had given an indication that the first major step in the battle against single use plastic will be initiated on October 2. In this regard, the Central Pollution Control Board (CPCB) has already chalked out a dozen items proposed to be banned —thin carry bags, wrapping films, straws and stirrers, disposable cutlery, plastic sticks used in balloons, ear buds and candies, cigarette butts, thermocol, small beverage bottles less than 200 ml, and roadside banners. While this seems to be a great idea to mitigate pollution, it is certainly not without its costs. For starters, there is no unanimity on the definition of single-use plastics. SUPs are generally regarded as disposal plastics. Often used for packaging, they include items intended for use only once. The European Union, describes ‘single-use plastics’ as plastics as products made of plastic such as cotton-bud sticks, cutlery, plates, straws, sticks for balloons, cups, food, beverage containers made of polystyrene and products made of oxo-degradable plastic, etc. An Amazon India spokesperson, however, offered a different definition, “We consider 100% recyclable material with thickness greater than 50 microns and a minimum 20% recycled content as non-single use plastic.” This means that the list would excludes multilayered packaging in which snacks like chips, nuts, and candies are sold. These are almost never recycled and, therefore, ignored even by rag-pickers. Added to this is the ambiguity surrounding the Extended Producer Responsibility (EPR) under the Plastic Waste Management Rules, 2016. EPR mandates that producers, importers and brand owners — like fast-moving consumer goods (FMCG) and pharma companies — take back the plastic waste generated by their products with the help of waste-management companies. What makes the system ineffective according to Mr. Afroz Shah, a lawyer and environmental activist, is the lack of proper implementation of these rules and also the lack of clarity on how much of plastic used by the company has to be taken back. Further, from carry bags, plastic drinking bottles, plastic bottle caps, food wrappers, plastic grocery bags, plastic sachets, plastic wrappers for consumer goods to air conditioner, fridge and other consumer appliance manufacturers; e-commerce; hospitality; and restaurants, SUPs seem to have become an indispensable part of life. According to data collated by PlastIndia Foundation, a conglomeration of associations and institutions that deal in plastic, India consumes an estimated 16.5 million tones annually. It further states that as much as 43% of this is estimated to be plastic manufactured for single-use packaging material. The industry is also worried about a supply chain disruption caused by the ban ahead of the festive season. “The ban has ramifications for all sectors like food processing, dairy, garments and toys,” stated Jayesh Rambhia, All India Plastic Manufacturers Association. The ban could disrupt supplies of key products such as biscuits, salt and milk. Moreover, implementing the ban is also likely to weaken consumer demand as it is likely to lead to factory closures and job losses at a time when the economy is already under the grip of a slowdown. Having an annual turnover of Rs 2.25 lakh crore, India’s plastic-processing industry employs over 4 million people according to the All India Plastic Manufacturers’ Association (AIPMA). It is also estimated that about 80% of the total plastic produced in India is discarded immediately and will find its way to landfills, drains, rivers and flow into the sea. The obvious solution in this kind of a scenario seems to be to curb the very root cause of plastic pollution – plastic – and to look for environment friendly alternatives. One problem with this approach is the commercial viability of these alternatives. Many manufacturers of PET bottles are convinced that PET remains a more viable and economical option to sell packaged beverages when compared to glass bottles and aluminium cans. At the same time, the higher cost of non-plastic packaging is likely to drive up the price of a number of essential goods, thereby, directly affecting the disposable incomes of the poor. Further, replacing plastic with alternatives also entails ecological costs. Paradoxically enough, the total environmental footprint of plastic is actually much lower than that of alternatives! According to a study conducted by the Danish government in 2018, you need to use a paper bag 43 times to achieve the same cumulative environmental impact as a plastic bag! Replacing plastic bags with the cloth ones using virgin cotton may not be that environment friendly after all. The same is the case with kulhad (earthen cups) and paper bags as they are made from top soil and wood pulp and harm the environment. There is also no clear evidence that curbs on plastic use have succeeded in achieving the desired results. A 2018 analysis by the United Nations Environment Programme of bans and levies on plastic bags and Styrofoam in 60 countries found that while in 30% of the cases, there was a drop in

Packed Water Bottles
HS CODE: 220110 and 220190 • From 2014 to 2018 due to rising concern regarding various health problems, which may arise by drinking of contaminated water, the global bottled market grew to over US$ 200 billion following 9% yearly growth. • The bottled water market is expected to surge at a CAGR of 9% from 2019 to 2024. The market studied is well established, and is growing at a decent pace. As per the volume, the market escalated by 100 billion litres in the last four years. • According to value, the market is going to touch around US$ 350 billion by 2021, following 10% year-on-year growth. • The Indian market is expected to reach US$ 60.06 billion by the end of 2023, from its current value of US$ 24.1 billion, expanding at a compound annual growth rate (CAGR) of 20.75% from 2018. Market Overview The bottled water market is expected to surge at a CAGR of 9% from 2019 to 2024. The market studied is well established, and is growing at a decent pace. As per the volume, the market escalated by 100 billion litres in last four years. According to value, the market is going to touch around US$ 350 billion by 2021, following 10% year-on-year growth. The volume growth will be a bit lower, but not by a significant number, at 9.3%. Global per capita average expenditure on packed water bottle will also continue to grow till 2021, burgeoning to US$ 45.3 by 2021 from US$ 32.3 per head in 2017. This growing demand can be credited to consumer propensity for specifically demanding high-quality drinking water, the fear of diseases as an aftermath of drinking polluted tap water, and the ease of portability and convenience provided by bottled water. In cognisance of this trend, the introduction of eco-friendly packaging and flavoured water with regulated ingredients can provide an opportunity & prospect for global market growth. Bottled water manufacturers are capitalizing on innovative packaging strategies of bottled water to reinforce their brand image and to create distinction in the bottled water market. These innovative packaging options include transparent sophisticated bottles, recyclable and resealable package material and coatings applied on a can to enhance the customer experience through unique visual effects along with increasing shelf appeal. For example, recently a firm manufactured a slim, 330ml bottle with a transparent label, permitting the customer to see the purity of the water. Bottled water companies are involved in purifying and bottling water, and then marketing and distributing it for commercial and personal use. End users for bottled water group constitute both on-trade and off-trade consumption that includes institutional and retail customers. Retail customers can purchase bottled water from different retail or food service formats. Institutional customers such as restaurants, offices and hotels purchase bottled water from wholesalers or distributors. Geographical Dimensions The bottled water market demand in Asia-Pacific is the largest in the world by volume. It currently has about 42.5% share of the global bottled water market. Increasing awareness & hygiene standards along with rudimentary public water infrastructure in various Asia Pacific countries is a key factor fuelling the proliferation of the bottled water industry. The bottled water market in Americas (North & South) is the second largest in the world by volume. It currently has about 30.8% share of the global bottled water market. Increasing hygiene awareness, lack of well-developed public water infrastructure and demand for functional bottled water are some of the factors that are driving bottled water market in the Americas. By product type, packaged drinking water – was still the largest segment in the global bottled water market. By packaging, plastic bottle was the largest segment in the global bottled water market. By pack size, 1501 ml and above is the largest segment in the global bottled water market. Bottled water consumers are increasingly adopting new products with health benefits. Functional water has added functional value in the form of minerals, oxygen and vitamins. Since consumers prefer to try new tastes and follow the best of them, the availability of a range of flavors and options in functional water will boost the market growth Global Trade Source: Trade Map 2019 Packed/bottled water is a prospective industry that’s growing significantly. If we observe the global exports of packed water bottle, it grew by a CAGR of 3% in the last five years. Top exporting economies are France, China, Italy, Belgium, USA and Germany. Top importing economies are USA, Hong Kong, Belgium, Germany, UK and Japan. Singapore imports 86% of its water demand in the form of bottled water. On the other hand, Nigeria has zero imports of bottled water. South Africa consumes the least bottled water per capita (8.3 litres per capita per year) and Saudi Arabia consumes the maximum bottled water per capita per year (365.3). The global bottled water market is highly uneven and fragmented with a large number of local players present in most countries. The leading players in the global market that have a multi-country presence are DANONE, Nestle, Coca-Cola and Pepsi-Co. Nestle Waters was the largest competitor in the bottled water market in 2017, followed by Danone, Hangzhou Wahaha Group Co., Ltd., Coca-Cola, Nongfu Spring Limited, Tingyi (Cayman Islands) Holding Corp and Pepsi-Co. Indian scenario The market is expected to reach US$ 60.06 billion by the end of 2023, from its current value of US$ 24.1 billion, expanding at a compound annual growth rate (CAGR) of 20.75% from 2018. Based on volume, the market is likely to reach 35.53 billion litres by 2023, expanding at a CAGR of 18.25% from 2018 to 2023. The major strength of India as a market is of course its population which is 17.6% of the global population. In addition to this, the per-capita income of Indians witnessed a growth of 8.1% in 2018. Moreover, increased awareness among the growing population about the importance of safe drinking water for maintaining good health, along with a sharp rise in per capita income is creating a demand for

Small Farms and India’s Agriculture Export Policy
• Government of India has announced first comprehensive agriculture export policy which has aim of doubling India’s agriculture exports and doubling the farmers income. • Inspite of having huge potential, India’s share in the world agri-export market is not considerable. • It is very important to have active export clusters at district level in order to tap the export potential of small and marginal farmers. • There are successful clusters in India such as Gujarat Cooperative Milk Marketing Federation (branded Amul), grape cluster in Maharashtra (mahagrapes), etc where small and marginal farmers are getting great benefits. India is an emerging economic power and in this transition, agriculture has to contribute a lot. In fact, the base of the Indian economy is agriculture – almost 60% people of this country are dependent on agriculture. Recently, the Government of India has announced the first comprehensive agriculture export policy, which has the aim of doubling the agriculture exports and doubling farmers incomes. In spite of having huge potential, India’s share in world agri-export market is not considerable. It demands strategic efforts to increase agriculture exports, as that will boost the agriculture economy. According to the Agriculture Census, average land holding in India is 1.15 hectares per farmer. In India 85% farmers are in marginal and small farm categories of less than 2 hectares. In these circumstances, clustering is the only solution for promotion of exports by small and marginal farmers and bringing them in the chain of agribusiness. Small farmers problems: 1. They have limited land and resources. 2. Their farm output is limited, due to which they can’t compete with big players in the market. 3. Domestic market is not organised hence market intelligence is not easily available to them. 4. Lack of input impact on productivity, which ultimately hampers price competitiveness. Unless farmers are encouraged to do business, it won’t uplift their socio-economic status. Hence, efforts must be in the direction of farmers thinking beyond production. Small holding farmers and export cluster: Involvement of small and marginal farmers in the export basket is a highly challenging task because they have limited resources. However, without the involvement of 85 million small and marginal famers in export business, India’s agriculture export policy will not be successful. Agriculture export significantly influences farmers incomes because if there is export it does have an impact on the price of the same product in the domestic market too. A single marginal farmer may not able to export, but with combined resources of a number of farmers, exports can happen. Therefore, It is very important to have an active export cluster at the district level in order to tap the export potential of small and marginal farmers; through this, they can have the benefits of an export business. Formation of an export cluster strengthens farmers by bringing common resources such as: • Common facilities for pre-cooling, cooling and storage, reducing the cost of market linkage, transparent standards of quality, mutually-owned insurance etc, can be availed collectively. • Brand building of product even at local level. • FPO’s and co-operatives linked with the farmers and exporters. • Reaching farmers at grass root level and strengthening the supply chain to avoid losses. • Emphasis on processing and value addition. • New start-ups in agri-exports at village level. Benchmark Clusters Globally and Locally: There are successful clusters in India such as Gujarat Cooperative Milk Marketing Federation (branded Amul), grape cluster in Maharashtra (mahagrapes),etc, where small and marginal farmers are getting great benefits. Even at the international level, clustering is successful; for the example France (wine), Japan (Kobe beef), Colombia (Juan Valdez coffee) and New Zealand (Manuka honey). Clustering in India’s New Agriculture Export Policy Product clustering is one of the important strategies in export promotion, hence unique export clusters have been identified in the agriculture export policy. Product wise and district wise clusters have been notified based on the existing production contributing to exports, exporters’ operations, size of export market, scalability etc. The products which have export potential include banana, pomegranate, mango, grapes, onions, potatoes, tea, coffee, marine products, chilli, turmeric, cumin, pepper, cardamom etc. The major share of agricultural land is with the small and marginal farmers and this major portion itself is left out from the circle of agribusiness and exports. Operational export clusters at the grass root level can channelise this major farmer’s force through their active participation in the entire value chain of agribusiness and exports, which will eventually double farmers income and exports. Dr. Parashram Jakappa Patil is currently an Advisor/Consultant at APEDA. He has also served as the President of The Institute for Natural Resources, Kolhapur. He is also an export policy consultant for the Ministry of Commerce and Industry. He has received many awards and accolades lately; some of which include Young Researcher Award, Best Citizen of India Award.
Evergreening of trade policy
• Developed and rich nations want WTO members to discuss, debate and agree on novel issues such as labour, e-commerce, NAMA and government procurement. But, at the same time, even while doing trade, India should not overlook the importance of environmental issues. • Effective and optimal environmental policies and institutional frameworks are needed at the local, regional, national, and international levels. The effect of trade liberalisation on a country’s overall welfare and development depends on whether appropriate environmental policies are in place within the country in question. • Trade governance can evolve and develop a true ally of multilateral efforts to guard and preserve the environment, including the Paris Agreement. Carbon pricing could assist as a mechanism to truncate the global carbon footprint of trade and to boost investment in green sectors. • It is crucial that environment and environment-related goods and services should find place in the new policy as it would focus on sustainability issues. This step has the capacity to bring down the inequality between the economies. WTO’s influence on development and protection of the environment comes in the form of fostering trade openness in goods and services to encourage economic development, and by providing steady and foreseeable conditions that boost the possibility of innovation. This encourages the optimized allocation of resources, economic growth and escalated income levels that in turn provide additional possibilities for shielding the environment. The vitality of trade’s contribution on sustainable development and environment-related issues has been recognized in such forums as the Rio Summit in 1992, Johannesburg Summit in 2002 and 2005 UN World Summit. Trade growth can frequently have environmental implications. Trade may increase ecological externalities at the national, regional, or global level. While it is usually economically advantageous for nations to follow their comparative advantage through trade, environmental impacts such as augmented pollution or natural resource degradation may also occur as a result of trade. The effects of trade on the environment are heterogenous and varied. Figure 1: Temperature change for India in degree Celsius in 2018 Source: FAO STATS, 2019 Agricultural cropping patterns transformed by the introduction of export-centric crops may encompass environmental harm or benefit. Secondary effects of trade may engender from the disruption of existing communities, increased migration, and impact on marginal lands. Pollution generated from manufacturing and industrial sector may be increased, reduced, or shifted in regional impact. International trade agreements make some provisions and scope for resource conservation and environmental protection, but these are usually limited exceptions to a general principle of free trade. Within the World Trade Organization framework, members are allowed to take into account the environmental impacts of products, but not those related with production processes. This has led to several trade disputes over whether specific measures are justified on the grounds of protection of life and health, or are simply disguised protectionist practice. Policy responses to trade and environment issues can occur at the national, regional, or global level. Majorly, European Union as a free trade area is an example that has set up institutions for transnational environmental standards enforcement. The North American Free Trade Agreement (NAFTA) was accompanied by a side agreement setting up an environmental monitoring authority, the Commission for Environmental Cooperation, but this body has little enforcement power Effective and optimal environmental policies and institutional frameworks are needed at the local, regional, national, and international levels. The effect of trade liberalisation on a country’s overall welfare and development depends on whether appropriate environmental policies are in place within the country in question (e.g. correctly pricing exhaustible environmental resources). Stringent environmental policies are compatible with an open trade regime as they create markets for environmental goods that can subsequently be exported to countries that follow suit on environmental standards – the so-called first-mover advantage. This is especially true for complex technologies such as renewable energies. Countries have initiated and implemented numerous environment-related efforts under the World Trade Organization (WTO) framework including negotiating tariff reductions in environmental goods and services, looking for more clarity on the relationship between prevailing WTO rules and explicit trade obligations in multilateral environmental agreements. Economies are also in process to construct cogent dictums on fisheries subsidies. In this way, the WTO is building a multilateral framework for international trade that also discourages any misguided temptation to engage in a “race to the bottom”. The incorporation of environmental provisions in bilateral and regional trade agreements has also facilitated the harmonisation of environmental regulations between developed and developing countries. More advanced and developed economies can provide capital, resources and institutions for capacity building, and can inspire less-developed partners to strengthen environmental regulations. The OECD has brought out and addressed eclectic issues on trade and environment such as the drivers of environmental provisions in Regional Trade Agreements (RTAs), as well as the strictness of environmental policies as a driver for trade in goods in environmental goods and services. International organizations like OECD and WTO are also currently developing a set of norms and policy indicators on trade and environment to help monitor progress towards more policy coherence, and to identify policy priorities at the intersection of trade and environment. Developed and rich nations want WTO members to discuss, debate and agree on novel issues such as labour, e-commerce, NAMA and government procurement. But, at the same time, even while doing trade, India should not overlook the importance of bringing in environmental issues. Indian policymakers are concerned about it, and will like to have an agreement on environment in WTO. It is crucial that environment and environment-related good and services should find place in the new policy as it would focus on sustainability issues. This step has the capacity to bring down and abridge the inequality between the economies. Trade governance can evolve and develop a true alliance of multilateral efforts to guard and preserve the environment, including the Paris Agreement. Carbon pricing could assist as a mechanism to truncate the global carbon footprint of trade and to boost investment in green sectors. The global trading mechanism must also

12 much needed transformations that National Logistics Policy will unfold
• An effective and efficient logistics ecosystem is one of the drivers of the Indian economy. • In spite of this knowledge, logistics cost in India, estimated at 13-14% of GDP, is very high compared with more efficient global economies and the sector continues to be highly unorganized. • In this kind of a scenario, the National Logistics Policy gains salience as it will enable in creating a single point of reference for all logistics and trade facilitation matters in the country. • The policy will provide an impetus to India’s industrial competitiveness and hence have a positive impact on exports. We all know that an effective and efficient logistics ecosystem can be a key contributor to robust economic growth in the country, as this sector is one of the most important accelerators of trade in the country. Specifically, an efficient supply chain network has the potential to increase farmers’ incomes manifold, which can lead to a domino effect on the overall economy. Despite the recognition of logistics being a critical driver of economic development, logistics cost in India, estimated at 13-14% of GDP, are very high (US 9-10%, Europe 10%, Japan 11%) compared with more efficient global environments, and the sector continues to be highly unorganized. India also has a skewed modal transportation mix, with 60% of freight moving on roads, which is significantly larger than in key developed economies. The following are some of the changes that National Logistics Policy will bring: It will enable creating a single point of reference for all logistics and trade facilitation matters in the country, which will also function as a knowledge and information sharing platform. It will also help in driving logistics cost as a percentage of GDP down from estimated current levels of 13-14% to 10% in line with best-in-class global standards and incentivise the sector to become more efficient by promoting integrated development of logistics. Further, it will optimize the current modal mix (road-60%, rail-31%, water-9%) in line with international benchmarks(25-30% share of road, 50-55% share of railways, 20-25% share of waterways) and promote development of multi modal infrastructure. The policy will also go a long way in improving first mile and last mile connectivity to expand market access of farmers, MSMEs and small businesses. It will also provide a strong impetus to the MSME sector in the country through a cost-effective logistics network. The policy will ensure standardization in logistics (warehousing, packaging, 3PL players, freight forwarders), creating a National Logistics e-marketplace as a one stop marketplace. It will involve simplification of documentation for exports/imports and drive transparency through digitization of processes involving Customs, PGAs etc in regulatory, certification and compliance services. It will also entail the creation of a data and analytics center to drive transparency and continuous monitoring of key logistics metrics. It will at the same time, provide an impetus to trade and hence economic growth by driving competitiveness in exports and double employment in the logistics sector by generating additional 10-15 million jobs and focus on enhancing skills in the sector and encouraging gender diversity. Further, it will lead to the strengthening the warehousing sector in India by improving the quality of storage infrastructure including specialized warehouses across the country and promoting cross regional trade on e-commerce platforms by enabling a seamless flow of goods. The policy will create a single window logistics e-marketplace – A National Logistics e-marketplace, which will be set up by the Logistics Wing, as a one-stop marketplace. It will be a single window transactional platform. This single window portal will onboard various logistics service providers like transporters, warehousing providers, shipping lines, 3rd party service providers, freight forwarders, customs brokers etc and various government agencies including Customs, Partner Government Agencies (PGAs) etc. involved in regulatory, certification and compliance services. Along with this, the policy also envisages to set up a Logistics Data and Analytics Center. The policy will be creating a Center of Trade Facilitation and Logistics Excellence (CTFL) and leverage expertise of multilateral agencies. This center will ideate and identify intervention areas critical for streamlining logistics in the country and to drive innovation in the logistics sector. The CTFL will also focus on identifying global best practices in logistics, and adapt the same to India’s context.

Economic slowdown: Breaking the vicious cycle
• India’s GDP growth of 5% in the quarter ending June 2019, has shocked analysts, raising fears of a prolonged slowdown. • The FM has announced a number of measures including bank mergers, liquidity boosters for realty and exports, and more recently a major cut in corporate tax rate to 22%. • Measures for spurring growth in focus sectors are welcome, but bank mergers would also imply tough integration challenges. • While the measures so far are sure to boost supply, India still suffers from a tenacious sluggishness in consumer demand, for which the centre has little fiscal room. India’s economic growth has been consistently slowing down over the past few quarters, from a high of 8% in the quarter ending June 2018. It hit a six year of 5% in the quarter ending June 2019. Reports indicate that a number of sectors, including real estate, construction, auto, manufacturing agriculture and FMCG are struggling. Consumer demand continues to be weak, and private sector investment is also not picking up. Eight core sectors have seen a slowdown in growth to 2.1% in July 2019 compared to an increase by 7.3% in the same month last year. Chances of consumer demand picking up seem weak, as even the unemployment rate has reached 8.2% in August 2019, with urban unemployment even higher at 9.4%. Even the external environment is extremely volatile, with India’s exports dropping by 1.53% YoY in the first five months of this fiscal. There is a severe lending crunch, and even foreign investors are pulling capital out of the market. Banks have lost an enormous Rs 12 lakh crore over the past few years in NPAs. NITI Aayog Vice Chairman Rajiv Kumar has commented, “This is an unprecedented situation for the Government of India. In the last 70 years nobody had faced this sort of situation where the entire financial system is under threat and nobody is trusting anybody else. Within the private sector nobody is ready to lend, everyone is sitting on cash.” The Hon’ble Finance Minister Ms Nirmala Sitharaman has announced a series of measures over the past few weeks for revival of the economy and business confidence. She announced the withdrawal of enhanced surcharge on tax payable on long-term and short term capital gains arising from transfer of equity share/unit for foreign portfolio investors on August 23. On August 30, she announced a series of bank mergers including PNB, OBC and United Bank (total business of Rs 18 lakh crore); Canara & Syndicate Bank (business of Rs 15.2 lakh crore); Union Bank of India, Andhra Bank and Corporation Bank (business of Rs 14.6 lakh crore) and Indian Bank and Allahabad Bank (business of Rs 8.08 lakh crore). The government also announced an upfront capital investment of Rs 55,250 crore to support credit growth and regulatory compliance. On September 14, the government announced the introduction of Remission of Duties and Taxes on Export Product to replace MEIS scheme for exports. The FM assured that fully automated electronic refund for input tax credits on GST will be operational by end-September 2019. Most importantly, priority sector lending norms for export credit have been revised, thereby releasing an additional Rs 36,000 crore to Rs 68,000 crore as export credit under priority sector. For real estate, the government committed to create a fund of Rs 20,000 crore for last-mile funding of non-NPA and non-NCLT projects, of which Rs 10,000 crore will be contributed by the government. In another big bang measure to boost confidence, the FM announced on September 20 that any domestic company would have the option to pay income tax at a rate of 22% subject to the condition that they do not ask for any other exemption/incentive. Moreover, with effect from FY 2019-20, any new company incorporated on or after October 1, 2019 making fresh investment in manufacturing, has the option to pay income-tax at the rate of 15%. Again, they will not be allowed to avail any exemptions, and they should commence production on or before March 31, 2023. She admitted that this would mean foregone revenue of Rs 1.45 lakh crore, but asserted that the step was essential to boost the economy. These measures announced by the FM are welcome, as they indicate a proactive approach to managing the economic situation with fiscal measures as well as the willingness to undertake course correction on policy measures if needed. Moreover, given that tax revenues are underperforming with an expected shortfall of Rs 40,000 crore this fiscal, these measures are indeed bold. The cut in corporate tax is pathbreaking and has been praised by the industry across the board, and gave an unprecedented 1,650 point boost to stock markets last Friday. These measures will definitely improve private sector sentiment. Priority sector lending for exports, faster refunds for MSMEs and introduction of RoDTEP will reduce uncertainty and make life easier for exporters. However, from the perspective of the US$ 5 trillion vision, boosting India’s foreign trade will require far more structural reforms. Bank mergers do impart scale and muscle and can help weaker banks; but a lot depends on the manner in which mergers are executed. The correlation between size and performance, and even the ‘too big to fail argument’ was devastatingly crushed with the Lehman-led recession of 2008. In the short-term, these mergers are sure to face a backlash from public sector employees. Even if rationalisation does not lead to job losses, it will surely impact hiring. Integrating operations, is always a painful and arduous exercise, requiring significant management bandwidth. So whether this is even an opportune time for mergers is debatable, given the key role of banks in reviving credit to tackle the economic slowdown. While the measures announced so far will lift business sentiment, the current slowdown has much do with the consumption problem, which was affirmed by RBI in its annual report. Share of private sector final consumption expenditure (PFCE) has dropped significantly from 66.2% of GDP during FY12-FY14 to 57.5% in FY15-FY19. It

ICT import duties: Keeping India’s house in order
• Taipei, following EU, USA, Japan etc. has raised concerns over India’s custom duties on certain Information and communication products. • India is alleged to have violated the ITA1 agreement of WTO that binds the signatories to maintain zero tariffs on IT products. • India’s demand for electronic goods is estimated to reach US$ 400 billion by 2025 while India’s domestic production is able to meet only a third of domestic demand, leaving a huge void for imports to fill in. • Measures to curb imports and protect domestic industry are understandable in the short term. But in the long run, India needs to build industry competitive across the value chain to control its looming deficit in this sector. India is a signatory to the Information Technology Agreement, 1996 of WTO along with 81 other signatories. The agreement requires the signatories to bind tariffs and other taxes on IT products at zero i.e. eliminate taxes and tariffs completely. The objective of the ITA declaration was to support and facilitate trade in the information technology sector, thereby achieving free flow of information technology and make the world more connected. The agreement, now called ITA1, was expanded at the Nairobi Ministerial Conference in December 2015 by over 50 members. This conference concluded the expansion of the Agreement including countries like US and EU and calling it ITA. India’s imports in ITA1 products have increased from US$ 1 billion in 1996 to US$ 32 billion in 2015, registering an average annual growth rate of 20%. On the other hand, exports increased from half a billion in 1996 to just US$ 2.2 billion. This tremendous growth in imports probably restrained India from signing the ITA2 agreement. In recent years, several countries like Japan, USA, EU and now Taiwan have invoked dispute settlement proceedings against India at the WTO alleging that India levies higher than zero bound tariffs on Information and Communication Technology (ICT) products and that these duties are in conflict with the India’s schedule under ITA1. Products under review include 11 sectors such as laboratory/pharmaceutical glassware, apparatus for manufacture of semiconductors, transmission apparatus, measuring instruments, insulated cables, electrical transformers and telephone sets including mobile phones, to name a few. As per WTO, India has increased its custom duties in the union budgets of 2007-08, 2014-15 and 2018-19. According to data extracted from ITC Trade Map (at 6-digit HS code level), China, Hong Kong, Vietnam, Korea and Singapore are the top 5 exporters of these products in 2018. Imports from China and Korea declined from 2017, while that of Hong Kong, Vietnam and Singapore increased. From Taipei, India’s imports stood at US$ 402.8 million in 2018, up by 25% from 2017. As per the 6-digit level, China, Hong Kong and Taipei are the top 3 global exporters of these products (on aggregate). On the tariff line level, India’s global imports on the products has been on the upward trajectory for most of the products, except for some products like mobile phones. Overall, on the tariff lines (32 tariff lines have been identified) in Taipei’s notice at WTO, India’s total imports have increased by 50% from US$ 15.3 billion in 2014 to US$ 22.8 billion in 2018. Clearly, rising imports is a concern for the government since it has been trying to make India a manufacturing hub for electronics and communication devices under the MAKE IN INDIA campaign. Higher duties have been imposed to protect and encourage domestic manufacturers, in the wake of imports substitution policy. Moreover, it has been maintained by the government that the products under scrutiny do not fall strictly in the ITA1 schedule which was signed in 1996 when these products did not exist. They have been developed after 1996 and thus are not a part of the agreement. Bearing in mind India’s ambitions of becoming a vital part of the global value chain in manufactured products and being able to compete with the other Asian giants, especially China, non-zero tariffs on the products are justified. In fact, value added in electronics has increased from US$ 31.2 billion in FY 2015 to US$ 65.5 billion in FY 2019 because of the government’s measures to improve the competitiveness of Indian electronics manufacturers through tariff structure rationalisation, infrastructure upgradation, simplification and provision of incentives. Electronics exports from India increased by 39% YoY to reach US$ 8.9 billion in 2018-19. Domestic mobile phone production has enabled a decline of mobile phone imports (as seen in imports of HS 85171290) as well. This shows that Indian industry is on the right path to shift the status from net importer to manufacturer and exporter. If the trend persists and develops further, the Indian industry has the potential to compete with China and others as well. Clearly, the electronics import bill is quite unsustainable for India at present, and it necessitates short-term measures to curb imports in dire situations. Given that India’s electronics hardware demand is expected to reach US$ 400 billion by 2023-24, it is even more critical to strengthen the local manufacturing ecosystem for electronics, and components. Otherwise, it could be another pain point for India’s battle against its huge trade deficit.

Services trade restrictiveness: Greater objectivity means better decisions
• India exported services worth US$ 205 billion and its services imports amounted to US$ 176 billion in 2018. The largest services exports categories were other business and computer services and the largest import categories were transport and other commercial services. • The world economy has witnessed the rise of new services such as outsourcing, rise of BPO, KPO and many retail services. Amidst the fast pace of globalization and busy lifestyles, consumerism in services is noticing a buoyant trend. • Air transport, engineering services and sound recording are the three sectors with the lowest score relative to the STRI across all countries for India. • India has contested the methodology of the OECD, and is developing an index of its own to measure restrictiveness of trade partners on mobility of professionals. Services sector has become a key growth imperative for many economies in the world and especially for India. Trade in services in recent years has emerged as one of the key drivers of the world economy. Rapid growth in trade in services especially in the late 1990s and 2000s has inspired, particularly many emerging economies such as India and some of the developing economies to adopt and implement liberalised and complementary policies to take advantage of available opportunities. The world economy has witnessed new trends of services such as outsourcing, rise of BPO, KPO and many retail services. In the fast pace of globalization and busy lifestyles, consumerism in services is noticing a buoyant trend. As progress of trade in goods sector is largely determined by tariff reduction and non-tariff barriers, the services sector is largely controlled through regulation. It is important to note that even if regulation is a key determinant of rise in trade in services, deregulation is required at some stage to provide a boost to the sector. While India’s integration with the global services market happened largely through the US and EU markets, slowdown in India’s trade was also felt as these markets experienced effects of global financial crisis and protectionist tendencies of the US. This led India to explore other markets such as East and Southeast Asia to find a foothold in services. Earlier on account of the language barrier and other cultural factors, Indian companies were doing business transactions mainly with Western companies, but now they have started diversifying their market presence. India exported services worth US$ 205 billion and its services imports amounted to US$ 176 billion in 2018. The largest services export categories were other business and computer services and the largest import categories were transport and other commercial services. India’s score on the STRI index in 22 sectors is presented below along with the average and the lowest scores among the 45 countries included in the STRI database for each sector. Source: ITC Trade Map Creation of an energetic and competitive services sector is fast becoming a key characteristic of modern economies. In 2015, services’ value added accounted for 74% of GDP in high-income countries as compared to 69% in 1997. The transition from agriculture through manufacturing to a services economy has been the hallmark of economic development for many countries. In line with this trend, it is noticed that many emerging markets are currently undertaking serious efforts to support and develop services industries, and to put in place the regulatory structures required for more integrated international services markets. The STRI helps to identify which policy measures restrict trade. It provides policy makers and negotiators with information and measurement tools to improve domestic policy environment, negotiate international agreements and open up international trade in services. It can also help governments identify best practice and then focus their domestic reform efforts on priority sectors and measures. The STRI database is based on regulations currently in force. STRI indices take the value from 0 to 1, where 0 is completely open and 1 is completely closed. They are calculated on the basis of information provided in the STRI database. India has an above average STRI score in all sectors. Sectors are categorised into two groups: prohibited sectors and permitted sectors. In the permitted sectors, investment can take place either through the government route where prior approval is needed, or the automatic route where no approval is required. In some sectors, the automatic route applies up to a certain threshold beyond which approval is needed. Additional horizontal measures affecting all sectors are regulations on transfers of shares between residents and non-residents, which are subject to pricing guidelines, and regulations on mergers and acquisitions; which usually take place through the establishment of a holding company in India. India applies labour market tests for natural persons seeking to provide services in the country on a temporary basis as inter-corporate transferees, contractual services suppliers or independent services suppliers. These categories may stay in the country for up to 24 months on their first entry permit. However, multiple entry business visas are awarded for up to five years with each stay limited to six months. At least one of the board members and the managers in corporations must be residents of India. Finally, there are preferences for local suppliers in public procurement. Services Trade Restrictiveness Index for India Indicator 2018 Accounting 0.83 Courier 0.57 Distribution 0.44 Commercial banking 0.52 Insurance 0.57 Logistics cargo-handling 0.4 Logistics storage and warehouse 0.4 Logistics freight transport 0.32 Logistics custom brokerage 0.33 Construction 0.37 Road freight transport 0.32 Rail freight transport 1 Architecture 0.68 Engineering 0.3 Legal 0.89 Motion Pictures 0.32 Broadcasting 0.44 Sound recording 0.28 Telecom 0.42 Air transport 0.57 Maritime transport 0.4 Computer 0.38 Source: OECD Database Air transport, engineering services and sound recording have the lowest STRI score across all countries. In all three sectors, however, the scores are still higher than the mean. Engineering is not a regulated profession at the national level and the sector is subject to the general policy framework. The sector-specific trade restricting regulations in sound recording are a statutory monopoly on copyrights management. Air transport is the sector with the highest

Country Profile: Italy
• The Italian economy grew at a CAGR of 0.25% over the past fourteen years, which is less than the average in EU. • Italy is the third largest economy in EU and overall eight largest economy by nominal prices and 12th by purchasing power parity in terms of GDP. • Italy’s exports and imports grew at CAGRs of 1.5% and 2% respectively from 2014 to 2018. Major exporting partners are Germany, France, USA, Spain and UK. • India-Italy bilateral trade in 2018 stood at US$ 10.8 billion, compared to US$ 10 billion in 2017. Italy is the third largest economy in EU and overall the eighth largest economy by nominal prices and 12th by purchasing power parity in terms of GDP. As a major advanced economy, Italy is a founding member of the European Union (EU), the Eurozone, the OECD, the G7 and the G20. It has closest trade ties with other countries of the EU, with whom it conducts about 60% of its total trade. Italy is among the largest manufacturers and exporters of a variety of products including clothing, machinery, pharmaceuticals, vehicles, furniture, food and robots. The country is also well known for its influential and innovative business ecosystem, an industrious and competitive agricultural sector and high-quality and premium offerings in automobiles, naval, industrial, appliance and fashion design. Italy is the largest hub for luxury goods in Europe and the third luxury hub globally. It owns the world’s third-largest gold reserve, and is also the third largest net contributor to the EU’s budget. Furthermore, it’s among the world’s largest in terms of quantum of private wealth. Source: World Bank The Italian economy grew at a CAGR of 0.25% in the past fourteen years, which is less than the average in EU. During the current time period, The economy has been broadly stagnant for the last five quarters. In the second quarter, GDP was flat from the previous three months and down 0.1% on a year-on-year basis. Italy’s new government expects the economy to expand by only about 0.4% next year after eking out 0.1% growth this year. Macroeconomic indicators of Italy GDP at nominal price US$ 2.08 trillion GDP at PPP (Purchasing Power Parity) US$ 2.40 trillion Population 60.6 million Expected GDP growth rate in % 0.1% – 0.2% GDP growth in 2018 0.9% GDP Per Capita $39,725 at PPP Inflation 0.8% Unemployment Rate 9.8% Contribution in GDP Agriculture (2.1%), Industry (23.9%), Services (73.9%) Ease of doing business rank 51 FDI Stock US$ 553.2 billion Debt to GDP Ratio 132.2% Source: Compiled from various sources The economy is anticipated to remain sluggish this year, bogged down by both a weak domestic economy and challenging external environment. Uncertainty, weak business environment and slow credit growth will all hamper investment, while risk of financial turbulence remains elevated given the political situation and the country’s precarious fiscal position. Export and import partners of Italy, in US$ billion Top importing partners Top exporting partners World 499.35 World 543.47 Germany 82.94 Germany 68.23 France 42.97 France 56.87 China 32.67 USA 49.98 Netherlands 27.21 Spain 28.19 Spain 24.32 UK 27.33 Source: ITC Trade Map, 2019 Trade basket of Italy Exports of Italy, in US$ billion Imports of Italy, in US$ billion Total 543.47 Total 499.35 Medicaments 12.70 Crude petroleum oils 32.52 Medium oils and preparations 10.25 Natural gas in gaseous state 15.85 Articles of jewellery 8.94 Automobiles (SUVs) 14.81 Light oils and preparations 6.43 Medicaments 12.40 Parts and accessories, for tractors 6.03 Small cars 12.21 Appliances for pipes & boilers 5.54 Medium oils and preparations 8.32 Automobiles 5.26 Immunological products 6.36 Immunological products 5.13 Mobile telephones 5.46 Wine of fresh grapes 4.98 Refined copper 3.36 Handbags of leather 4.80 Electrical energy 3.07 Source: ITC Trade Map, 2019 Source: ITC Trade Map, 2019s Italy’s exports and imports burgeoned by CAGRs of 1.5% and 2% respectively from 2014 to 2018. Major exporting partners of Italy are Germany, France, USA, Spain and UK, while major importing partners are Germany, France, China, Netherlands and Spain. India-Italy trade relations India-Italy bilateral trade in 2018 stood at US$ 10.8 billion, as compared to US$ 10 billion in 2017. India’s exports to Italy increased by 3.3% in the last five years and imports increased by 4.7% for the same period. India’s exports and imports to Italy are each roughly half of the total bilateral trade. Italy accounted for 2.3% of India’s total investment in the EU. Source: ITC Trade Map India’s major exports to Italy include flat rolled iron products, unwrought aluminium, accessories of automobiles, polyacetals, coffee, automobiles, footwear, heterocyclic compounds, synthetic organic colouring etc. Major Indian imports from Italy includes light vessels and fire floats, accessories for tractors, machines and mechanical appliances, transmission shafts, dishwashing machines, pumps for liquids, printing machinery etc. Top product categories in terms of export potential are readymade garments, yarns, leather products, chemicals and dyes, iron ore, marine products, agricultural and engineering items, gems and jewellery, carpets, coffee and pharmaceuticals. Italy can look forward to enhance exports of chemicals, pharmaceuticals, metals, plastics, apart from transport, food processing, energy and telecommunications to India. Italian companies are actively participating in the Make in India campaign by offering collaborations in areas such as food processing, infrastructure, heavy machinery, renewable energy, advanced technology, as well as information and communication technology. In all, approximate 800 Italian companies are already active in India. Both economies are looking to enhance cooperation in energy, railroad safety, bilateral investment, joint training programs for foreign services, cultural exchange and diplomatic ties. India and Italy are jointly working in the areas of infrastructure, tourism, railways, food processing, renewable energy, information technology and agriculture.