

In her interaction with TPCI, Dr. Arpita Mukherjee, Professor, ICRIER, talks about the ongoing dynamics of the US-China trade war, and how India should negotiate its interests at the WTO, especially on key issues like S&DT and e-commerce rules. TPCI: There goes a popular adage – that when US sneezes, the world catches a cold. How true is this in the present global scenario when it comes to trade and economic linkages? Dr. Arpita Mukherjee (AM): The US has been a proponent of the free market for a long time and the trade war between the US and China is primarily on technological supremacy. While the US had earlier opened its doors to allow goods to come in, China had imposed a lot of barriers on American technological firms. To pressurise China to open its markets to US technological players, the US is now imposing barriers on imports from countries, which are taking protectionist policies for its technology firms. This has led to a number of countries taking protectionist measures; sometimes on their own and sometimes as a retaliation, which is adversely impacting global trade including trade in goods, services, e-commerce, etc. China, today, is as strong in terms of technology as the US, it has a large number of patents and has made huge investment in R&D. However, the closed-door policy, which has so far helped Chinese firms to grow in the domestic market also makes it difficult for them to expand globally. For example, China has kept its domestic market closed through policies like on soil data localisation requirement, but if it now wants to expand global e-commerce trade, it has to change the policy and become more open to global companies including American companies. China realised this and joined the WTO e-commerce group. Today, due to the fourth industrial revolution with technologies such as AI, machine learning and robotics, workforce is no longer a key factor in determining where the industry is located. So, the dependence of global companies on certain markets with low cost manpower like India & China will not be a core determinant of gaining global competitiveness. Countries like India are being entangled into this. The protectionism of US did not initially touch us. It touched India only when we brought out data localisation, which has been heavily borrowed from China. This made us a target. We are in between – neither as aggressive as China, nor as open as the US. So, we will be badly hurt because we are implementing restrictions in a hitherto open economy. TPCI: What is your view on the steady rise in the number of multilateral trade deals being signed without the US like RCEP, Belt & Road initiative, etc? AM: RCEP is a mega trade agreement and is expected to cover issues beyond the WTO. One belt, one road (OBOR) is about China trying to become a global leader and establish its supremacy. A WTO framework is always better than mega trade agreements. Exports from India have slowed down and I don’t think India will gain in terms of exports of goods and services from RCEP in the short run; but there may be political gains and gains through investment flows, technology and collaboration. These gains will depend on the quality and depth of agreements and I think that India needs to do a more comprehensive research and review of regulations rather than its traditional focus on mode 4 or labour mobility. TPCI: Given the growing unilateral and protectionist policies by the US, are these deals a way to subvert America’s dominance and reduce dependence on its (US) economy? AM: Even if such trade agreements are signed with other countries, least developed countries will turn to US/EU/Japan for aid. US is one of India’s key export markets for goods and services. I do see the growth of China and a competition to the US, but economies like us will continue to depend on the US. Moreover, the supremacy of a country over another country is not just confined merely to trade agreements. TPCI: Given the tactics by the US related to the delay in the appointment of judges, do you think that WTO Appellate Body is in danger of failing? AM: US has been a major stumbling block in the WTO. On one hand, it has been raising a number of disputes against countries like India and on the other; it is delaying the appointment of judges to the Appellate Body. If one examines closely, the US and EU have different goals and missions at the WTO, but despite their differences, they agree in terms of challenging the kind of subsidies given to the state-owned enterprises in the WTO, export-linked subsidies given by India and the localization policy in e-commerce. US is also going for plurilateral agreements in areas of interest to its companies. TPCI: What should be India’s approach on issues like S&DT and e-commerce at the WTO? AM: India can ask for S&DT since we are a developing country. In e-commerce, we should have done a comprehensive survey and taken expert and legal advices. We have not even entered the e-commerce negotiations with 70 other countries, so we don’t know what’s really going on there. Can India afford to be out of the negotiations? We need to understand views of different players and then take an informed decision. I think we need strong regulation and policies in areas like data protection and privacy and policy should be based on consultation and these should be put in the public domain. TPCI: Will the rise in multilateralism we see in global trade counter US unilateralism? AM: Who will counter the US? China? As far as trade in goods and services is concerned, China already caters to half of the world’s population. As far as trade in goods is concerned, China is a global production hub. But as far as technological prowess and strategy are concerned, US had an edge over China, until recently. Things may change in the

Product Profile: Coal
HS CODE: 2701 • Current proven reserves of coal in the world are estimated at 1.1 trillion tonnes, which is sufficient for the next 150 years • India is the world’s second largest importer of coal, and the commodity contributed US$ 24 billion to its trade deficit in 2018. • The recent announcement of allowing 100% automatic FDI in coal mining will be crucial in substituting imports with domestic production and increasing capacity utilisation. • However, difficulties in land acquisition, environment clearances, and tough domestic competition can negatively impact investor sentiment and delay expected gains in domestic supply. The real impact of this policy may only be visible over the medium term. One of the most important fossil fuels in the world, coal is a combustible hard rock formed by the decay of plants in swamp waters. According to the World Coal Association, the current proven reserves of coal amount to 1.1 trillion tonnes worldwide, sufficient for use over the next 150 years at current rates of production. Major reserves of coal are found in regions of North America, Australia, Europe, Asia Pacific, India and China. There are basically four major ranks of coal – ranks indicating the steps in the process of coalification of the plant debris. These are – anthracite with a carbon content of over 87%; bituminous with 77-87% carbon content; sub-bituminous with 77-87% carbon content and lignite with carbon content of 60-70%. Another rank of coal with carbon content less than 60% is called peat. As the carbon content decreases, the heating value falls. China and USA are the leading producers of coal in world followed by Australia and India. On the consumption front, China, US, Russia, India and Japan accounted for over 75% of worldwide coal consumption. Coal is the biggest source of energy in India. As of April 1, 2018, the total estimated coal resources in the country were 3,19,020.33 million tonne as per “Indian Coal and Lignite Resources-2018” by the Geological Survey of India. Major reserves are in Jharkhand (83.15 billion tonnes), Odisha (79.29 billion tonnes), Chhattisgarh (57.21 billion tonnes), West Bengal (31.67 billion tonnes) and Madhya Pradesh (27.99 billion tonnes). Major coal fields are – Talcher, Mand-Raigarh, Raniganj, Godavari, Jharia, North Karanpura, Rajmahal, Singrauli etc. According to the Ministry of Coal, production of coal amounted to 675.40 MT in 2017-18(Provisional) and 730.354 MT (Provisional) in 2018-19, with a positive growth was 8.1%. Coal India limited (CIL) is the biggest producer of coal in India whose contribution in production was 567.36 million tonnes during 2017-18 and 606.887 MT (Provisional) in 2018-19. The HS code for coal is 2701, where 2701.11 is for Anthracite, 2701.12 for Bituminous coal, 2701.19 and 2701.20 for coking coal and others. As per the present import policy, coal can be freely imported into India. Worldwide, Australia, Indonesia, Russia, USA and Colombia are the leading exporters of coal, accounting for nearly 80% of the total exports. These countries are also the leading exporters of bituminous coal. On the other hand, Japan, India, China, Korea and Taipei are the biggest importers of coal, and together account for 63% of global imports. Source: ITC Trade Map, Values in US$ million In the year 2018, India imported coal worth US$ 24,611.76 million while exports were recorded at just US$ 94.44 million. In quantity terms, 227.35 million tons of coal was imported into India in 2018, which was less than domestic production of 675.40 MT in 2017-18 (provisional) and 730.354 MT (provisional) in 2018-19. This indicates that imported coal is needed to meet the excess demand. Primarily coal is used in production of electricity and in the Indian steel industry. This also points towards the heavy reliance on fossil fuels for energy generation – nearly 72%, when the government is stressing on alternative sources like solar energy. This is reflected in the observation that apparently, nearly 88% of India’s coal is non-coking grade (M/O coal) which is used in power generation and industries like cement, fertilizer, glass, ceramic, paper, chemical and brick manufacturing, and for other heating purposes. In fact, 77% of import quantities in 2018-19 (P) were of non-coking coal only. Table 1: Top 5 importing partners of coal and types for India 2701 Coal 270119 Coal excluding anthracite and bituminous coal 270112 Bituminous coal Value imported in 2018 Value imported in 2018 Value imported in 2018 World 24611.8 World 22652.8 World 1681.2 Australia 9,295.8 Australia 9,117.9 Indonesia 600.4 Indonesia 6,891.3 Indonesia 6,290.9 USA 429.4 South Africa 3,049.1 South Africa 2,774.9 South Africa 265.5 USA 2,063.9 USA 1,634.4 Australia 177.8 Canada 868.6 Canada 840.5 Russian Federation 124.5 Source: ITC Trade Map Coal is one of the top 5 imported products annually and contributes nearly US$ 24 billion to India’s trade deficit in 2018. Recently, India allowed 100% FDI in coal mining and associated infrastructure under the automatic route. Given that out of more than 300 bn tons of reserves, not even 1% is being produced (only 730 million tons produced), easier norms for FDI would allow global players to enter Indian coal fields and boost the production. This seems in line with the government’s objective of achieving production of 1,500 million tons by 2022 to reduce import dependence. Thermal power capacity is expected to reach 290 GW by 2030 compared to 225 GW currently. Entry of private players can help boost competitiveness as well as supply of coal to meet the domestic demand, besides bringing down prices. However, difficulties in land acquisition and environmental clearances for coal mining can have a detrimental impact on the government’s plans. Moreover the dominance of state-owned coal major Coal India, with economies of scale and huge production capacity of over 600 mt, can prove to be a major entry barrier for new players in the sector. So the eventual impact of this decision will only be seen in the upcoming 5-10 years.

Indian economic slowdown: How to reinvigorate consumer sentiment
• Real GDP growth in the year 2018-19 was at 6.8% which further plummeted to 5% in the first quarter of 2019-20. • The Gross capital to GDP ration has remained lower in 2019-20 at 32.3% as compared to the average ratio of 36.9% between 2009-10 and 2014-15. • For Q1 of 2019-20 as well, the investment seems to have grown at just 4% vis-à-vis the 13% in 2018-19. • Domestic demand has been cited as a major factor behind lower investments and thus slower growth of the economy. Policy measures have to be instituted to address declining wage growth and poor rural demand. India’s GDP growth of 5% for the quarter ending June 2019 has come as a shock for analysts. This compares to 5.8% in the previous quarter and 8% in the June quarter last year, and is the lowest growth in 6 years. Manufacturing was a major casualty during the quarter, with a growth of only 0.6% YoY. GVA dropped to 4.9% compared to 7.7% in the same quarter in 2018-19 and private consumption has also seen a fall. In its Annual Report for 2018-19, RBI asserts that “this deceleration could be in the nature of a soft patch mutating into a cyclical downswing”. It has assessed that India’s real GDP growth grew at an average of 7.7% during 2014-18 and 8% in Q1 of 2018-19. However, the economy started losing momentum thereafter, and the growth rate for 2018-19 remained at a lower 6.8%. Gross fixed capital formation started slowing down more than anticipated, inflicting its adverse impacts on the manufacturing and net exports as well. The growth of value added in agriculture and allied activities decelerated from Q3, pulling down rural demand. Overall, growth of GVA in agriculture declined from 5% in 2017-18 to 2.9% in 2018-19. On the other hand, growth in industrial production also slowed down to a less than 4%. The slowdown in agriculture and industry has impacted employment and income generation across the economy. Although inflation remained below target of 4% for two successive years – 3.6% in 2017-18 and 3.4% in 2018-19 – the current account deficit (CAD) settled at 2.1% of GDP in 2018-19 from 1.8% in the preceding year as the trade balance worsened more than the improvement in balance of invisibles compared to previous year. The report also attributes the slowdown to external factors such as protectionist policy actions in the form of bilateral tariff escalations, sanctions and retaliations, normalisation of ultra-accommodative monetary policy by the Fed and tapering down of quantitative easing (QE) by the ECB, which are being transmitted to the domestic economy by different channels. Due to weak external demand, export volumes moderated despite a real depreciation. Terms of trade worsened on account of rising international crude oil prices. Foreign monetary policies such as interest rate increases and balance sheet contraction have led to huge capital outflows. In fact, the trade channel has itself become the mode of transmission of global impulses to domestic manufacturing and investment. Besides this, the slowdown in domestic demand is the fundamental factor that has impacted the animal spirits in India’s economy. Greater harvests during the preceding two years have created supply glut, which coupled with weak export demand has added to the pressure on the already limited storage capacities, thus lowering food prices and farm incomes. This has eventually led to a lower consumption demand, since 44% of the total labour force depends on agriculture for livelihood. Rural demand has been red-flagged by firms from FMCG to auto sectors, and the last Nielsen quarterly report concludes that rural demand for FMCG products is slowing down by twice the rate of the slowdown in urban demand. Therefore, the deceleration in the growth of sales due to slowdown in demand has induced the industry to use the existing capacities to the fullest instead of making new investments. The report recommends that policymakers focus on measures like improving the ease of business, factor market reforms, public capital expenditure etc. The challenge at this hour is to boost farmers incomes to resume growth in consumption while maintaining lower food inflation. RBI has stressed on adoption of model APMC by states as the farmers would be able to sell the produce to bulk buyers and thus get assured prices. Apart from that, development of food processing can also push demand up. For the year 2019-20, RBI’s Monetary policy committee has recently lowered its projection of real GDP growth by 50 basis points to 6.9% recently from its previous forecast. Moreover, the first estimates for the Q1 of 2019-20 has estimated real GDP growth for the quarter to fall to a six-month low rate of 5%. As per the data released by CSO, it is observed that the growth rate of gross fixed capital formation component of GDP has declined from 13% in Q1 2018-19 to just 4% in Q1 of 2019-20. In the previous year, a slowdown in domestic demand was the root cause of slowdown in investment and economy. It seems that investment sentiments have not improved in the ongoing financial year. If the consumption slowdown stays, policymakers will have to work to reverse the trends, particularly in the rural sector. Companies from FMCG and automotive sectors alike have warned on the impact of rural slowdown on their quarterly results. Better implementation of policies that are aimed at boosting farmers’ income could help in revival. In this direction, marketing, pricing and storage policies have to take the lead to ensure that the surplus in agricultural sector produces is not rotting due to lack of storage and reaches the masses at remunerative prices for farmers. However, the government has to also ensure a balance in terms of also keeping food prices low. Gross savings rate has fallen from 31.1% of GDP in 2015-16 to 30.5% of GDP in 2018-19, driven by the decline in household savings. There has also been a decline in growth of both urban and rural wages over the

Indian food processing: Roadmap towards value addition
• India’s food processing sector is regarded as a sunrise industry as it is has tremendous potential for growth and contribution to the Indian economy. • Despite being blessed with factors conducive to the development of this sector such as a bounty of raw materials and cheap labour, India’s food processing industry still has a long way to go. • Fragmentation of agricultural markets, which causes supply chain inefficiencies, technological obsolescence & infrastructural bottlenecks is a major factor constraining the sector. • In order to combat these challenges to the growth of this sector, focus needs to be given on investing in state-of-the-art technology, imparting the necessary skills to farmers, enhancing the ease of doing business and so forth. Over the last few decades, the massive pace of urbanization in India has left an indelible mark across the length and breadth of the country. This has been accompanied by the rise in dual career households and consequently, a trend towards ready-to-cook/eat products. Given the growing preference among customers for packaged food, the scope for India’s food processing sector is quite bright in both the domestic and global markets. Added to this is the fact that India has a pool of young workers and an abundance of raw materials at its disposal. India is a leading producer of milk, fruits & vegetables, tea, spices, coffee & pulses cereals and marine products. Source: APEDA (value in US$ billion) However, despite being blessed with factors that are conducive to the development of this sector, the segment accounts for a meager 11% of agricultural value-added and 9% of manufacturing value-added. In terms of global performance too, India’s agricultural exports constitute barely 2% of the total exports. This compares to 4% for Brazil, 7% for Argentina and 9% for Thailand. India’s processing level of perishable products is at around 10% as compared to US (80%), Malaysia (80%), Thailand (30%) and Australia (25%). Due to weak processing infrastructure, around 16% of fruits and vegetables and 10% of pulses, oilseeds and cereals are wasted every year. If managed properly through world class processing and packaging facilities, this produce can be better directed towards domestic and export markets. Besides bringing down wastage, this can also fetch better returns due to value addition. Currently, share of high value and value-added agri produce in India’s agri-export basket is less than 15%, as compared to 25% for US and 49% for China. This keeps India at the lower end of the global agri export value chain. In horticultural products for instance, India lacks in terms of uniformity and standardisation as well as its ability to cut down on losses across its value chain. There exists a gap in the kind of produce grown by Indian farmers and the SPS/TBT standards that exist in global markets. This gap translates into lack of farm-to-fork traceability of products. What has made attaining traceability difficult is the complexity of the distribution system, which involves not just the farmer and end consumer but several middle men in the picture. This frequent change of hands makes it difficult for the consumer to hold someone accountable when issues such as food safety and quality arise, thereby impacting credibility of Indian farm exports. In addition, several infrastructural bottlenecks also bog down the sector. More investment needs to take place in food processing machinery, grading and packaging. At the same time, the country lacks an end-to-end cold chain network. A proper cold chain infrastructure is a must for a tropical country like India, where food is likely to perish more quickly. Currently about 60% of them are situated in just four states—Uttar Pradesh, Punjab, West Bengal and Gujarat. Further, lack of last mile connectivity along the food production & distribution chain also hampers the quality of food – be it the raw materials or the finished products. The fact that most of the workers employed in this industry lack adequate skills also affects the industry. Majority of farming in the country is being done by small farmers who posses inadequate finances and education. This has grave implications for the Indian food processing industry’s competitiveness in global markets. The economy has not witnessed an appropriate growth in education and training infrastructure. National Skill Development Corporation (NSDC) estimates that as many as 17.8 million persons in the food processing industry need to be imparted skills by 2022. Measures including establishing mega food parks, bringing out a revamped model APMC Act, comprehensive implementation of e-NAMs, facilitating warehouse sales, reducing transportation costs and introducing 100% FDI in marketing processed food products made in India by the government are steps in the right direction. Industry stakeholders need to be imparted with the desirable skills. This entails both promoting agricultural best practices in farms as per global food safety parameters and stepping up on skill training in the food processing industry. The government needs to establish traceability in the food supply system. This will be a much needed step in order to bring about a decrease in instances of food adulteration, fraudulence and foodborne disease outbreaks as well as help build consumer confidence. Information and communications technologies, a regulatory authority, certification & tracking of goods will facilitate India’s transition towards traceability. This will go a long way in building the credibility of India as a quality food basket across the globe. Lastly, the government needs to invest in build a holistic infrastructure network. This encompasses investing in machinery, building connecting roads & ports, having cold storages in all states and having forward & backward linkages.
Raising the bar for India’s marine exports
• With a coastline of about 8,118 kilometers, India is the second largest producer of inland fish in the world and accounts for about 10% of the global fish diversity. • Fish and fish products stemming from India constitute around 10% of total global exports and almost 20% of agricultural exports. • Despite faring well in global export markets, India’s marine industry lags in areas like value addition due to critical gaps in supply chain including the seasonal nature of wild catch and low average utilisation of processing capacity. • In order to take India’s seafood exports a notch higher, the stakeholders must consider measures to add value to India’s seafood and ensure that it adheres to global quality standards. Enveloped by a coastline of about 8118 kilometers, India’s placid tropical waters are the quintessential breeding ground for a rich variety of marine life. It is hardly surprising that India is touted as the second largest producer of inland fish in the world and accounts for about 10% of the global fish diversity. The sector is particularly significant to India, not merely from the prism of its nutritional value and food security, but also for its economic contribution. Estimates show that aquaculture provides gainful employment to about 14 million people and contributes roughly Rs. 45,106.89 crore (0.91%) to India’s GDP. Over 50 different types of fish and shellfish products are being exported to 75 countries across the globe. Fish and fish products constitute around 10% of total exports and almost 20% of agricultural exports. India’s exports of fish products (chapter 3) declined by 8.7% YoY to reach US$ 6.3 billion. The government and facilitating agencies like Marine Products Export Development Authority (MPEDA) have already taken a few steps to address these challenges. For instance, MPEDA is quite active in taking initiatives such as participation in international fairs, engaging in buyer-seller meets and joining hands with FAO’s INFOFISH to disseminate information by organising seminars on latest happenings in seafood sector. It has also been instrumental in offering financial assistance to the industry for subsistence. Despite faring well in international export markets, India’s marine industry lags behind its global counterparts in value addition. Share of value-added products in terms of volume in India’s exports is only 5% against 64% for Thailand, 35% for China and 26% for Vietnam. Experts are of the opinion that if India wants to capitalize on its advantage of having a rich marine biodiversity, then value-addition to marine products is the way forward. This is critical given the short shelf life of marine produce. Making ready-to-cook retail packs of fish and shrimps of different types like pickles, canned tuna, fish soups, etc. elongates the life of these products. But due to critical gaps in the supply chain including the seasonal nature of wild catch, the average utilisation of processing capacity is only 25-30%. Indian seafood exports are also crippled by challenges in intercontinental markets due to serious concerns over quality. For instance, European Union had raised the sampling frequency for Indian exports from 10% to 50% in 2016. This added to costs for exporters and affected their competitiveness. This measure was born out of fears in the trade block that inadequate measures related to quality were being practiced in some aquaculture farms in India. Further, there has also been a rise in India’s border rejection rate on the grounds of hygiene issues, antibiotic residues, advancement in scientific knowledge, and apprehensions by consumers. Sometimes, political pressures such as ‘tit for tat refusals’ result in higher border rejections of India’s marine exports too. Facts on India’s fisheries sector Present fish production (Capture) 7.0 MMT Inland 3.2 MMT Marine 3.8 MMT Potential fish production 8.4 MMT Fish seed production 40,000 million fry Hatcheries 1,604 units Fish Farmers Development Agencies 429 Brackishwater Fish Farms Development Agencies 39 Source: National Fisheries Development Board In addition to these steps, India can take its seafood exports a notch higher, by investing in adding value to its marine produce. With the rapid rise in urbanization and the rise in the number of working couples, ready to eat products such as lobster curry, fish pickles, marinated prawns, shrimp soups, etc. would be in great demand not just globally, but also in India. Initiatives must also be taken to impart knowledge and training to those involved in aquaculture pertaining to the global standards of quality. They should also be supported in their endeavours to market this value added produce in domestic and global markets. India should build on both intra- and interdisciplinary knowledge and methods. At the same time, India must also negotiate with key partners like EU to lower the 50% benchmark limit set for sampling frequency. Measures such as the certification of farms and hatcheries would help build international confidence in the robustness of India’s hatcheries. The industry could also tackle the seasonal nature of the produce by importing raw material for value addition and re-export. This will have trickle down effects like enhancing employment generation, improving profit margins and helping judicious use of resources.
“Trade and FDI are complimentary”
As the Foreign Trade Policy 2015-20 reaches the end of its term, Professor Manoj Pant, Director, IIFT, shares his insights on the highlights of the policy, its impact on trade performance, and the roadmap for policy to propel India’s external trade in the coming years. IBT: What were the salient features and drawbacks of India’s foreign trade policy during 2015-20? To what extent has it succeeded in fulfilling its objectives? Professor Manoj Pant: There were many features of India’s FTP 2015-20. Very broadly, there were largely measures to promote exports from India for manufacturing and services (MEIS and SEIS). However, more importantly, the main purpose was to promote exports by reducing complexities and encouraging Make in India. However, the Foreign Trade Policy was drafted at a time when the world trade was stagnant, growing at barely 1% or less per year. At the same time India’s exports are dominated by China, USA, UAE, Saudi Arabia, Switzerland etc., of which the only economy showing some significant increase is USA. Secondly, as expected subsidy schemes like MEIS faced WTO resistance. Hence, it is creditable that export volumes have at least remained the same. IBT: What roadmap do you envision for India’s new foreign trade policy and what should be the main actionable areas to address? What are the key parameters which need to be revamped for pushing our exports under the FTP’s purview? Professor Pant: The main need in FTP is to view it not merely as an Export Promotion Policy but also as a trade promotion channel. This implies two things. For one, it should be recognized that increased exports also entail increased imports. Hence, one needs to avoid protective tendencies as reduced imports could also reduce exports. Focus should be on promoting a value chain as a whole rather than only exports. Second, world trade is dominated by technology. Hence, it is important to integrate FDI Policy into trade policy as one cannot exist without the other. Our empirical work shows that trade and FDI are complimentary. You would expect actually a reduction in incentives for exports given the existence of the WTO and alertness of trade partners. The best method of promoting exports is to reduce transactions time, improve banking practices etc. In other words, we need to improve the environment for industry and trade. Regarding trade deficit, almost 80% of India’s trade deficit is accounted for by China and ASEAN. China uses many non-tariff barriers to restrict India’s exports of items like pharma and some important services. In addition, it is now acknowledged even officially that ASEAN is a vehicle for pushing exports into India while restricting India’s services exports. So the problem is not trade deficit per se, but that this deficit is pushed up by some of India’s leading trade partners through non-tariff barriers. IBT: What impact will the current external scenario (e.g. global economic slowdown, Brexit, US-China trade war and sanctions on Iran) have on India’s new FTP? Professor Pant: It is crucial that India does not respond to the current slowdown with protectionist measures as that would be self-defeating as I have already indicated in question No. 2. It is unlikely that Brexit would have a major impact on India’s trade apart from the general impact of the current economic slowdown, which is most severe in the UK and EU. The US-China trade war could have an impact if continued for long as both these countries are India’s principal trade partners. However, whatever be the end game in this trade war, it is clear that many companies located in China will think of diversifying their production network. While at present, Vietnam is the most obvious choice (in textiles etc.), from the long term point of view, India’s size makes it an obvious recipient. Here the business environment in India will be the most important factor. We have to also think of changes in our product mix, for example machinery and electronics, as these are China’s principle exports. IBT: Given the mounting cases against India’s subsidies at the WTO, what factors should be kept in mind to draft policies consistent with WTO’s agenda? Professor Pant: As India becomes large and in the current market conditions, the cases against India’s subsidies will grow. Export subsidies like MEIS and SEIS will be the obvious culprits. Reducing the cost of production by improving domestic logistics and removing incentives related to size of a company is the correct way forward. IBT: How can the FTP shape up India’s framework to adapt to Good Agriculture Practices, as it is crucial for any economy to harmonise standards as a trade policy practice? Professor Pant: It is my view that India will never be a very large agricultural producer given the size of the domestic demand and the unfavourable land-man ratio compared to agricultural exporters like USA, China, Brazil, Australia etc. India will continue to be an important exporter in traditional items like spices and some foodgrains. But, for the agricultural sector, exports are more likely in the case of processed food where technology, quality assurance and packaging are crucial determinants. Having a Ph.D. from the Southern Methodist University, USA in 1982, Professor Pant taught at prestigious institutions like Jawaharlal Nehru University, Indian Institute of Management & Delhi University. In 2017, he became the Director and Vice-chancellor of Indian Institute of Foreign Trade. He has also worked in the past with the Ministry of Commerce, Planning Commission and Ministry of Human Resource Development. His areas of interest include International Trade Theory, Foreign Investment, Competition Policy and the WTO. The views expressed here are his own.

India-Chile PTA: An opportunity to raise the stakes
• The high income economy in the South American region is known for its copper and lithium reserves, deep trade liberalisation policies and fundamentally strong political and financial systems. • Chilean economy with a population of 18.73 million (2018) is dominated by the service sector followed by manufacturing sector, which makes it an important market for India’s goods and services alike. • The average MFN tariff in Chile is 5.98% (2017) while for India it is 13.8% (2017). • In another expansion of India-Chile PTA, Chile has the motivation to ask for more and higher concessions compared to the existing version. India can look to expand the ambit to cover services trade. Chile is one of the fastest growing and high income economies in the South American region. The economy is characterised by a high level of foreign trade which forms 28% of its GDP and is dominated by Copper exports (CIA World Factbook). Apart from copper, Chile is rich in gold and lithium, both of which are of interest for India. Total trade between India and Chile crossed the US$ 1 billion mark in 2016. As per data from ITC Trade Map, the average annual growth rate of India’s exports to Chile between 2014 and 2018 has been 10% p.a. while imports witnessed a degrowth of 14% p.a. Trade flow from Chile to India has been dominated by a few products like copper ores, Molybdenum ores, fresh fruits like apples, pears, etc.. In terms of India’s exports to Chile, it is diversified and covers sectors like automobiles, iron and steel, pharma, chemicals, leather, apparel and textiles etc. The first India-Chile trade agreement that came into force was in 2007. The PTA was a limited agreement to offer tariff concessions on a limited number of products. While India has offered to provide fixed tariff preferences ranging from 10-50% on 178 tariff lines at the 8-digit level to Chile, the latter have offered tariff preferences on 296 tariff lines at the 8-digit level with margin of preference ranging from 10-100%. The products on which India had offered tariff concessions relate to meat and fish products, rock salt, iodine, copper ore, chemical, leather products, newsprint and paper, wood and plywood articles, some industrial products etc. Chile’s offer covered some agriculture products, chemicals and pharmaceuticals, dyes and resins, plastic, rubber, leather products, textiles and clothing, footwear etc (DoC, GOI). Between 2007 and 2018, India’s exports to Chile have increased by 300% while imports from Chile have decreased by 10%. Leaving aside the side effects of the global recession of 2008 and slowdown in 2013, bilateral trade has been following the upward trend. Following the implementation of PTA in 2007, India’s exports to Chile increased by 29% between 2006 and 2007 and by 81% between 2007 and 2008. On the other hand, imports from Chile increased by 22% between 2006 and 2007 and decreased marginally by 7% between 2007 and 2008 (ITC Trade Map). This PTA was expanded in 2017 when India offered concessions on 1,031 products and Chile expanded its list of products to 1,798 tariff lines (which is now 1,034 tariff lines in Indian schedule and 2,099 in Chilean schedule as per HS 2017). The major product groups covered in India’s offer are meat & meat products, fish & fishery products, vegetable oils, iron ore & coppers ores & concentrates, organic & inorganic chemicals, pharmaceuticals, washing preparations, plastic & rubber articles, articles of iron & steel and articles of wood & paper. The major product sectors covered in the Chile’s offer are agricultural products, organic & inorganic chemicals, pharmaceuticals, plastic & rubber articles, textiles, apparel, articles of iron/steel & copper, machinery & equipment (DoC, GOI). Following the implementation of the expanded PTA, India’s exports increased by 14% between 2016 and 2017, while imports increased by almost 40% during the same period. In 2018, India’s exports grew by 24% while imports fell by 0.3%. At the HS code level of 6 digit, top products from the PTA where the value of trade is significant are as follows: Product code Product label India’s exports to Chile (in US$ million) MOP Value in 2017 Value in 2018 In % 870322 Motor cars and other motor vehicles principally designed for the transport of persons 147.887 169.168 80 300490 Medicaments consisting of mixed or unmixed products for therapeutic or prophylactic purposes 48.11 61.113 60-80* 730511 Line pipe of a kind used for oil or gas pipelines, having circular cross-sections and an external 3.37 35.281 100 870323 Motor cars and other motor vehicles principally designed for the transport of persons 31.684 35.146 80 870321 Motor cars and other motor vehicles principally designed for the transport of persons 28.181 33.632 80 870421 Motor vehicles for the transport of goods, with compression-ignition internal combustion piston … 16.761 23.405 80 870332 Motor cars and other motor vehicles principally designed for the transport of persons 17.573 22.589 80 420329 Gloves, mittens and mitts, of leather or composition leather (excluding special sports gloves) 19.971 18.373 80 870899 Parts and accessories, for tractors, motor vehicles for the transport of ten or more persons 14.202 14.408 80-100* 630260 Toilet linen and kitchen linen, of terry toweling or similar terry fabrics of cotton 15.263 14.204 30-100* Product code Product label India’s imports from Chile (in US$ million) MOP Value in 2017 Value in 2018 In % 260300 Copper ores and concentrates 1356.969 1266.993 100 261310 Roasted molybdenum ores and concentrates 29.516 72.827 80 280120 Iodine 57.945 57.288 80 470321 Semi-bleached or bleached coniferous chemical wood pulp, soda or sulphate 41.578 39.578 80 710812 Gold, incl. gold plated with platinum, unwrought, for non-monetary purposes 0 22.084 80 470329 Semi-bleached or bleached non-coniferous chemical wood pulp, soda or sulphate 22.311 20.006 80 740311 Copper, refined, in the form of cathodes and sections of cathodes 1.999 17.578 50 81050 Fresh kiwifruit 7.543 14.189 50 760200 Waste and scrap, of aluminium 10.95 12.915 80 120991 Vegetable seeds, for sowing 17.702 9.605 50-80* (* indicates that there are multiple tariff

India & RTAs: Learning the right lessons from history
• The Finance Ministry has commenced a review of India’s past FTAs to analyse their impact on the economy. • The majority view is that these trade agreements have generally been more beneficial to the partner countries. • India’s trade with major trade partners in RTAs for past 12 years shows that India has been experiencing a trade deficit with them on an aggregate basis and this deficit has increased post-2013. • Stricter and well defined rules of origin are a must to prevent re-routing of imports through RTAs leading to revenue loss for government and enhanced competition for industry. With inputs coming from across sectors that free trade agreements (FTAs) have been a bane for India’s manufacturing sector, the Ministry of Finance has begun a comprehensive review of past FTAs. The review will try to ascertain the impact of these agreements on the overall economy, as the majority view seems to be that they have been more beneficial to the partner country. Moreover, the government is concerned over reports that imports have been re-routed through FTAs compared to the domestic tariff route when the government raises customs duty, thereby defeating the purpose of restricting imports of a particular product. According to the Department of Revenue there is a history of blatant violation of rules of origin and value addition norms to increase exports to India. History the best teacher? According to the RTAIS database of WTO, India is a signatory to 18 regional trade agreements (RTAs) that are in force at present including the Global System of Trade Preferences among Developing Countries (GSTP) and two accessions – to China in APTA and Afghanistan in SAFTA. Major RTAs of India are free trade agreements with ASEAN, Japan, Korea, Malaysia, Singapore & Bhutan, and partial scope agreements with Chile, MERCOSUR, Thailand, Nepal and Afghanistan. The first RTA that came into force was the Asia Pacific Trade Agreement in 1976. By the beginning of new millennium, only 3 RTAs were in force. However, between 2000 and 2010, the cumulative number of trade agreements increased to 14. Following the roller coaster ride, only 2 RTAs have been added to the list since 2010. This indicates that India was very ambitious towards enhancing regional trade in the first decade of the new century as 11 RTA came into effect. Source: RTAIS, WTO RTA Name Coverage Type Date of notification Notification Date of entry into force Status 1. Asia Pacific Trade Agreement (APTA) Goods & Services PSA & EIA 02-Nov-1976(G) 17-Jun-2019(S) Enabling Clause & GATS Art. V 17-Jun-1976(G) 17-Sep-2013(S) In Force 2. Global System of Trade Preferences among Developing Countries (GSTP) Goods PSA 25-Sep-1989 Enabling Clause 19-Apr-1989 In Force 3. South Asian Preferential Trade Arrangement (SAPTA) Goods PSA 21-Apr-1997 Enabling Clause 07-Dec-1995 In Force 4. India – Sri Lanka Goods FTA 17-Jun-2002 Enabling Clause 15-Dec-2001 In Force 5. Asia Pacific Trade Agreement (APTA) – Accession of China Goods PSA 30-Apr-2004 Enabling Clause 01-Jan-2002 In Force 6. India – Afghanistan Goods PSA 08-Mar-2010 Enabling Clause 13-May-2003 In Force 7. India – Thailand Goods PSA 18-Jun-2017 Enabling Clause 01-Sep-2004 In Force 8. India – Singapore Goods & Services FTA & EIA 03-May-2007 GATT Art. XXIV & GATS Art. V 01-Aug-2005 In Force 9. South Asian Free Trade Agreement (SAFTA) Goods FTA 21-Apr-2008 Enabling Clause 01-Jan-2006 In Force 10. India – Bhutan Goods FTA 30-Jun-2008 Enabling Clause 29-Jul-2006 In Force 11. Chile – India Goods PSA 13-Jan-2009 Enabling Clause 17-Aug-2007 In Force 12. Southern Common Market (MERCOSUR) – India Goods PSA 23-Feb-2010 Enabling Clause 01-Jun-2009 In Force 13. India – Nepal Goods PSA 02-Aug-2010 Enabling Clause 27-Oct-2009 In Force 14. ASEAN – India Goods & Services FTA & EIA 19-Aug-2010(G) 20-Aug-2015(S) Enabling Clause & GATS Art. V 01-Jan-2010(G) 01-Jul-2015(S) In Force 15. Korea, Republic of – India Goods & Services FTA & EIA 01-Jul-2010 01-Jan-2010 In Force 16. India – Malaysia Goods & Services FTA & EIA 06-Sep-2011 Enabling Clause & GATS Art. V 01-Jul-2011 In Force 17. India – Japan Goods & Services FTA & EIA 14-Sep-2011 GATT Art. XXIV & GATS Art. V 01-Aug-2011 In Force 18. South Asian Free Trade Agreement (SAFTA) – Accession of Afghanistan Goods FTA 29-Jul-2016 Enabling Clause 07-Aug-2011 In Force Source: RTAIS, WTO; PSA- Partial scope agreement; FTA – Free Trade Agreement; EIA – Economic Integration agreement A look at the graph showing India’s trade with major trade partners in RTAs for past 12 years indicates that India has indeed been experiencing a trade deficit with these countries on an aggregate basis and post-2013, the deficit has remained higher than pre-2013 period. These 24 trade partners account for nearly 20% of India’s exports and 17% of India’s imports. In the year 2018, India’s total exports to these countries were US$ 75.76 billion while imports were at US$ 98.16 billion. (Trade with Afghanistan, Argentina, Bangladesh, Bhutan, Brazil, Brunei Darussalam, Cambodia, Chile, China, Indonesia, Japan, Korea, Republic of, Lao People’s Democratic Republic, Malaysia, Maldives, Myanmar, Nepal, Pakistan, Paraguay, Philippines, Singapore, Sri Lanka, Thailand, Uruguay, Viet Nam; Source: ITC Trade MAP, Values in US$ million) Some of the significant studies and conclusions on the impacts of RTAs of India are as follows: 1. Jha(2013) reviewed the impact of India’s RTAs on traders. The study found that after implementation of these RTAs, both aggregate imports and exports increased but much of the increase in post-RTA exports was in non-preferential items, while preferential items were driving an increase in imports. 2. Nag, Sikdar (2011) and Sikdar, Nag (2011) argued that ASEAN members will derive more benefits in terms of welfare growth than India from the India-Asean FTA. ASEAN members will gain from higher ‘terms of trade’ effect while India would gain mainly from the resource reallocation and change in domestic production activities reflected through ‘allocative efficiency’, but these gains would get dampened due to the presence of negative ‘terms of trade’. 3. Ahmed (2010) analyzed the impact of the India-Japan FTA. The analysis also concluded that the FTA would result in welfare loss for India and gain
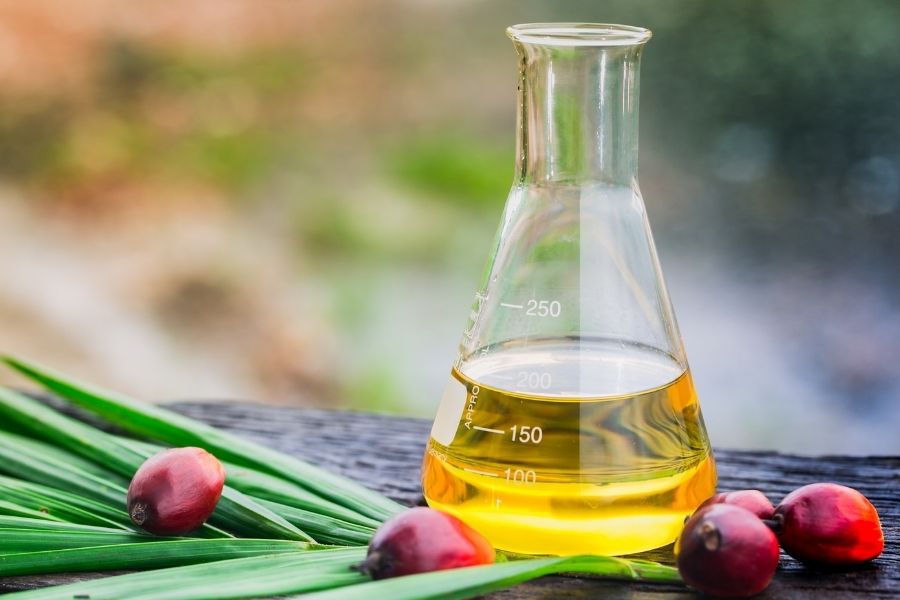
Palm oil: Why India is on slippery ground
• India is the world’s largest importer of palm oil, and imports have grown by 20 times over the past 25 years. • Palm oil accounts for around 60% of India’s edible oil imports, with Indonesia and Malaysia being the major source countries for the commodity. • Reduction in duties on refined palm oil compounded problems for domestic processors and packers, as it has impacted their capacity utilisation. The government has now imposed a 5% safeguard duty on refined palm oil from Malaysia. • The government is encouraging private participation to promote large oil palm plantations, since domestic production at around 200,000 tonnes per annum is still way below the actual demand. Image source: Shutterstock Palm oil is among the most commonly used vegetable oils in the world, as it is deemed as the most efficient and economical source of vegetable oil till date. Even if it is not a part of your kitchen shelves, an average consumer will be surprised to know that palm oil is a key ingredient in a number of packaged products on the supermarket shelves – be it pizza dough, instant noodles, shampoos, cosmetics, detergents, margarine, chocolates and ice cream. India’s palm oil imports have increased at a brisk pace from Indonesia and Malaysia, especially since the conclusion of the India-ASEAN agreement in 2009. India’s imports of palm oil and its derivatives (HS Code 1511) rose by a sharp 58.03% YoY in 2009-10 to reach US$ 4.04 billion. Indonesia took the lead with exports of US$ 3.2 billion followed by Malaysia with imports of US$ 750.4 million. They reached a peak of US$ 7.2 billion in 2011-12, after which growth has been erratic. In 2018-19, imports were recorded at US$ 5.23 billion, a decline by 22.73% YoY, with Indonesia still in the lead at US$ 3.36 billion and Malaysia at US$ 1.44 billion. Palm oil continues to heavily dominate India’s edible oil imports, and India is the largest importer of this product globally. Imports of palm oil (crude + refined) accounted for 60% of India’s total edible oil imports in 2018-19 (April-Jan). Out of the 73.21 lakh tonnes of palm oil imported during this period, 73.7% was crude, while the rest was refined. The government reduced duties on crude palm oil (from 44% to 40%) and refined palm oil (from 54% to 45% for Malaysia and 50% for other ASEAN countries) effective from January 1 this year. The special reduction for Malaysia was done under the provisions of the India-Malaysia CECA Agreement signed in 2010-11. The Solvent Extractors Association has noted a sharp increase in the imports of refined palm oil since the reduction of duty. They have requested the government to hike the duty on refined, bleached and de-odorised (RBD) palmolein or refined palm oil. According to the association, imports of refined palm oil increased from 1.3 lakh tonnes in December 2018 to 3.71 lakh tonnes in May 2019 the highest monthly figure since May 2013. During November 2018 to July 2019, imports of RBD palmolein have increased to 20.9 lakh tonnes, growing by 40% YoY. As a consequence of the duty advantage, Malaysia’s share in India’s palm oil imports has increased to 52% in the first half of 2019 compared to 30% last year. While Indonesia is also asking for a similar favour, SEA has complained that due to the rise in imports of RBD palmolein, operations of domestic refiners have been impacted and their capacity utilisation has come down. Even oil processors like Adani Wilmar have become packers as they are simply importing refined palm oil and selling in the domestic market. In response to the industry’s demands, the government imposed 5% safeguard duty on refined palm oil from Malaysia on August 26, so that imports of the product can be curbed. Meeting the huge demand Consumption of edible oil in India is estimated to be rising at a rate of 3.5% per annum, but production is not rising at the same rate. The government is making efforts to boost oilseed cultivation. Add to this the problem of excess supply of edible oils in the overseas market, due to which prices have dropped by 8-20% over the past year. Palm oil represents a major policy conundrum for India. Consumption of this product has increased by over 230% in India since 2001. The government had anticipated this demand surge way back in the 1980s and set up a committee to identify potential regions for cultivation. By 2012, 2 million hectares were identified, for which the government provided training to farmers apart from inputs and subsidised plant materials. Even private companies were encouraged to set up factories for processing in oil palm cultivation areas. Twelve states were covered under the National Mission on Oilseeds and Oil Palm (NMOOP) in the 12th Five Year Plan (2012-17) to expand the area under oil palm cultivation. However, the project has not progressed as anticipated and the expansion has consistently fallen short of the target. As a consequence, imports of palm oil have increased by over 20 times in the past 25 years. One major cause for this shortfall is that palm oil is not as lucrative for farmers with small landholdings. They require high maintenance and a long gestation period of at least 5-6 years before giving commercial returns. Moreover, the palm oil market is vulnerable to sharp price fluctuations that can be devastating for these farmers. While the NMOOP proposes and provides subsidy for intercropping, farmers have also argued that it could result in lower yields. In 2017, the government took further measures for boosting cultivation. The land ceiling limit on assistance for oil palm cultivation has been relaxed to over 25 hectares to attract more corporate interest as well as leverage maximum benefit from 100% FDI. Considering the limitations of promoting the programme in individual farmers’ fields, the government is counting on participation of private entrepreneurs, cooperative bodies and joint ventures to promote large-scale plantations. In the current fiscal year, the government plans to
“Exporters must learn from grape & rice industries”
In his exclusive interaction with TPCI, Azhar Tambuwala, Director – Marketing, Sahyadri Farms, speaks about the challenges confronting marginal farmers in India, the reasons that motivated them to open their business, the impediments to the exports of fruits and vegetables and the future roadmap for the industry. Image Source: Shutterstock TPCI: How did you come up with the idea of starting a business in this line (specify the sector)? Mr. Azhar Tambuwala (AT): The challenges of marginal farmers have existed forever in our country. Their general focus is on farming and they don’t completely understand marketing, branding, finance, technology and processing. They possess 2-5 acres of land, which is a lot for a city dweller; but the fact is that usually this land that they possess is hereditary and unlike the inhabitants of the cities, these people must earn a living from their small land. At an average, for 1 acre of land, they earn a revenue of about Rs 60,000 a year. So, for 2-5 acres, they are probably earning about Rs 3 lakh in a year. From this, they have to re-invest in farming, take care of their children’s education, medicals, food expenditure and other basic living expenses. In today’s world, this is fairly little for a man to survive with his family. From this paucity of money arise issues such as the lack of education of the girl child since she’ll get married and go away or when you take loans, its difficult to repay the amount from such a small land holding. Moreover, one bad season could lead to crop failure and revenue loss. This leads farmers to private money lenders who give loans on high interest rates, which they are unable to pay back if nature and markets do not support them. These factors lead to a state of depression, where families get disturbed and the farmer is forced to take the ultimate step. These are very deep-rooted problems, which are not just related to farming; they are social problems too, and there’s an urgent need to address these issues. So, the germ of Sahyadri was sown from this seed i.e. to basically create sustainable farming entrepreneurship, making farmers reliant on their own work & making farming profitable. We want to create sustainability from the farmer’s perspective till the consumer. The idea was to create a cooperative where we today have about 625 shareholders & 8,000 growers who’re linked to us. All our growers are marginal growers. We wanted to create value at the farm level by giving our farmers technological know-how. By bringing in agronomists to interact with them, we have our own weather stations informing farmers about weather conditions & advising them on preventive solutions rather than curative. We have an academy where we’re teaching farmers how to adapt to new trends and skill development; we take our farmers overseas for exposure visits, we have processing facilities for aseptic and frozen; we’re bringing in new varieties and building our own retail chains so that farmers have direct access to sell their produce; we have a range of FMCG products and an agri input division serving our growers with quality inputs at lower prices than the markets. We’re creating a sales network to penetrate into our domestic markets. All of this, a small farmer cannot do individually. It’s when people come together and create an organization, this value is created. So, it wasn’t a business idea; it was the need of the hour. It is about the duty that we have towards our society. TPCI: What were the initial challenges you faced, and how did you overcome them? AT: When we came up with the plans, initially we were not getting any bank support because no bank wanted to invest in a farmer’s cooperative of that size. Back then, we were being given loans at a higher interest, whereas now we are offered loans at less than half the rate. Today we’re a bankable entity. Secondly, our own growers needed to understand what we are out to do. So, one of our biggest challenges was to spread our philosophy among our farmers. All our initiatives were never tried before. There was no precedent. TPCI: Which markets did you tap for your product and why? What market penetration/promotion strategy did you follow? AT: In the beginning, since we were private people who were in the business of supplying grapes to Europe, we explored the European markets. Taking all that experience and understanding, we brought it into Sahyadri Farms. We built our value chains based on our experience of exporting grapes to Europe. Now, we are working on multiple markets of the world with a variety of products and brands. Our long term focus is our home market where there is true potential to be harnessed. TPCI: Who are the key competitors, and what unique competitive advantages have helped you establish your business presence? AT: Because we’re into so many different product categories, every product category has got its own uniqueness. So, it will be difficult to answer this question. Generally, when we are in grapes trade, we need to check the supply situation of our competitors like Chile, South Africa, Peru and plan the business accordingly. That goes for the other products too– melons, bananas pomegranates, mango and the vegetables too. Creating cost and product value at all stages has helped us establish strong business relations across the world. TPCI: What are the major tariff/non-tariff barriers that you have experienced in the international markets? What should be the roadmap to overcome these challenges? AT: Duties are charged in Europe, which make Indian produce expensive, whilst some others countries have preferential tariffs or no duty. In the US, you cannot supply any fresh fruits except for mangoes. As far as pesticides are concerned, I wouldn’t call them “barriers”, I would call this as a compliance which is not easy to meet. Our lab testing costs per year itself are around a few crores. The trade-related