

• From engineering well-organized wastewater drainage systems in the cities of Harappan Civilization to designing a fridge that can run without electricity, Indian innovation is well acclaimed globally. • Despite these achievements, India lacks way behind in terms of number of patents in force, and even the existing number is dominated by foreign entities. • A lack of industry-academia interface is a major failing in India’s innovation story so far, as corporates tend to rely on their own research instead of turning to academia • Initiatives like AMTDC Chennai will go a long way in helping Indian manufacturing firms compete more effectively in the global market. “Necessity is the mother of invention,” so goes the well-known English-language proverb. This adage is quite true when we look at the history of innovation in India. From designing well-organized drainage systems in the cities of Indus Valley Civilization to engineering a fridge that can run without electricity & the world’s lowest priced tablet PC, India has been a pivot of life changing ideas. Despite being the germination center for numerous remarkable inventions and discoveries, India doesn’t feature anywhere in the top 20 ranks in terms of global innovation. As the Global Innovation Index suggests, India secured 52nd position among 129 countries ranked on the basis of more than 80 indicators such as political environment, education, infrastructure and business sophistication, a major leap compared to 81 in 2015. Other Asian economies, however, including Singapore (8), China (14), Japan (15), Malaysia (35), Vietnam (42) & Thailand (43) are well ahead of India in this area. While the fact that India jumped from 57th position last year and 81st rank in 2015 is definitely a reason to celebrate, there’s a lot of work still left to be done in order for India to be regarded as the innovation hub of the world. Inspiring success stories The Mangalyaan launch by ISRO a few years back was a success story of many firsts, and brought India’s latent innovation potential to global centre-stage. However, the ecosystem for innovation in India certainly has many more miles to travel. A few years ago, professors Vijay Govindarajan and Chris Trimble and GE’s Jeffrey R. Immelt popularized the concept of “reverse innovation”, that is an innovation used first in the developing world, before being applied to the industrialized world. India is seen as the epitome of jugaad. A case in point is GE, which started shipping low cost products developed for emerging markets to the markets of Europe and the US, making affordable health care accessible for a large number of people. The US$ 1,000 electrocardiogram (ECG) device Mac 400 was developed at GE’s John H Welch Technology center (JHWTC) in Bangalore. Grassroots innovations abound across the length and breadth of the country. Researchers of IISc developed a low-cost solar water purifier, which can transform water from any source – including contaminated with arsenic, fluoride or sewage – into potable water. Karnataka has started using self-repairing roads modeled on the one devised by Professor Nemkumar Bhantia having a hydrophilic nano-coating and made with fly-ash (60%) and cement (40%). Hyderabad’s Jawwad Patel is the first Asian to develop a 3D-printed apparatus, which can ‘create’ drinking water from air. IITians are coming with very futuristic innovations like passive solar water wall to replace ACs, smart cane for visually impaired, solar powered cold storage and intelligent street lights. Need for better partnership On the other hand, India’s record in patents is quite low. On comparison of patents in force by filing office for 2017, India had 60,777 patents and was ranked 24, according to World Intellectual Property Organisation (WIPO). This is way below the leaders – US (2,984,825), China (2,085,367), Japan (2,013,685), UK (1,243,678) and South Korea (970,889); and is definitely not in sync with India’s vision of becoming a global economic superpower. Moreover, just 10,343 (17%) of these patents are by residents in India with the remaining 83% filed by non-residents. In 2017-18, Qualcomm filed 960 patents in India, more than all the IITs with 540 applications. Recently, at the launch of Niti Aayog’s Atal Community Innovation Centre, Shri Dharmendra Pradhan, Petroleum Minister noted, “India will not become US$ 5 trillion economy without innovation.” While India has the basic conditions that stimulate innovation – democracy, demography, diversity and unconventionality – it has not been able to efficiently harness these conditions to become a global innovation hub. This is despite facilitating factors such as the allocation of Rs 400 crore to establish world-class education systems in the budget, reducing the time taken to examine a patent claim or restructuring the higher education system. The key issue is that there is very little synergy between academia and industry in India , which leads to lower inclination and incentive for filing patents. Part of the problem is cultural, as corporates in India tend to rely on their own research due to existing stereotypes of academia and general lack of awareness. India would also do well to learn from its other counterparts who have fared better such as US (3) & Israel (10). The US has fast-tracked innovation through tax regulations that encourage venture capital, and laws (like the Bayh-Dole Act) that facilitate the adoption of academic research in the commercial world. This act enabled universities, non-profits, and other small businesses to earn patents to inventions. In Israel, the government has played a more direct role, particularly through the office of the chief scientist, which provides high-tech start-ups with seed funding. This has given Israel a dominant position in a lot of vital high-tech fields such as security software. Greenshoots of change are emerging like the Advanced Manufacturing Technology Development Centre (AMTDC), Chennai, an industry-academia collaboration set up at IIT Research Park and supported by Department of Heavy Industries. Indian companies are using this facility to indigenize their manufacturing facilities by designing machines that are at par or even better than global standards. More such initiatives need to be encouraged to help Indian technology firms compete more effectively

India-Pakistan relations: Suspending trade a typically Pakistani self-goal
• Pakistan has suspended trade ties with India after the latter’s decision to scrap Article 370 for Jammu & Kashmir. • However, the move has little practical impact, as Pakistan accounted for just around 0.3% of India’s total trade in 2018-19. • Despite attempts to liberalise trade in 2012, formal trade between the two countries has hardly grown over the years. • Rather than raising the bogey of Kashmir, which is India’s internal matter, Pakistan should work to de-escalate tensions and look to enhance the trade relationship in its own interest. Shocked and stunned by India’s decision to scrap article 370 in Jammu & Kashmir, Pakistan has been looking desperately at ways to express its displeasure and gain popular support. Some of the measures announced as a mark of protest include spending Pakistan’s Independence Day August 14 ‘in solidarity with Kashmiris’ and recognizing August 15 as Black Day. Furthermore, it has decided to downgrade bilateral relations and suspend India-Pakistan trade ties. The decision is yet another example of Pakistan’s short-sightedness and poor economic prudence. Pakistan has repeatedly tried to push its Kashmir agenda into talks with India and exported terror in its bid to keep the cauldron boiling. But the fact is that Jammu & Kashmir is purely India’s internal matter. Moreover, India had already removed Pakistan’s MFN status in February after the dastardly Pulwama attack and increased import duties by 200%. On the question of trade, the decision by Pakistan impacts its own economy more than India. From India’s perspective, Pakistan ranks 48th on its list of trading partners with total trade of US$ 2.56 billion in 2018-19, around 0.3% of India’s total trade (Department of Commerce). Pakistan’s imports from India in 2018 on the other hand take a relatively much higher share of 3.9% of its imports from the world. India has a significant trade surplus of US$ 1.57 billion vis-à-vis the trade equation, with top exports being cotton, organic chemicals, plastics, tanning or dyeing extracts, machinery, pharma, iron & steel and coffee, tea, mate and spices. Top items imported from Pakistan are mineral fuels, fruits & nuts, salt, Sulphur, etc, ores, raw hides and skins, and oilseeds. India-Pakistan trade has remained erratic over the past few years, due to the political issues. Mohit Singla, Chairman, TPCI comments, “We will not be losing much as Pakistan had not even granted us MFN status. Pakistan is an important export destination for India but not vice-a-versa. This is despite the fact that Pakistan imposes a large number of NTMs (143) on Indian exports, the major ones b1eing export related measures (25.2%); technical barriers to trade (24.5%); and sanitary and phytosanitary measures (22.4%). These are ‘concentrated on agriculture, plants, and food-related products.” On the other hand, India had granted Pakistan MFN status way back in 1996. The two countries had made substantial progress towards liberalization of India-Pakistan trade in 2012, when Pakistan moved from the positive list approach (allowing a small number of items to be imported) to a negative list approach (restricting trade in a small number of items) for the first time. India also made attempts to address non-tariff barriers. But this has hardly brought any significant gains, with trade fluctuating from US$ 1.94 billion to US$ 2.61 billion from 2011-12 to 2018-19. A study by ICRIER finds that besides the size of the trade pie, the post-liberalisation phase has also seen a moderate increase in the composition of India-Pakistan trade through rise in exports of products like organic chemicals, oilseeds, nuclear reactors and coffee, tea, mate and spices. Tea itself is an example of unmet trade potential. Pakistan is the second largest tea importer in the world, and largely imports Kenyan tea despite neighbourly relations with India. Sujit Patra, Secretary, India Tea Association (ITA), comments, “From less than 1 million kg in the 90s, tea exports reached a peak of 25 million kg at one point due to consistent efforts by ITA, exchange of delegations and education of Pakistani importers/blenders on the quality and varieties of Indian tea.” However, in the last few years delegations have stopped due to various reasons, and exports have fallen. In 2018, tea exports to Pakistan from India reached 15.83 million kg. India exported 5 million kg in January-June, 2019, a significant decline compared to 7.4 million kg in January-June, 2018. On the other hand, informal trade continues to garner a significant share. According to a study, the informal India-Pakistan trade was estimated at US$ 4.71 billion in 2012-13, much higher than the formal trade. This included items like jewellery (24%), textiles (20%), machinery and machine parts (8%), electronic appliances (6%) and chemicals (5%). India’s informal exports to Pakistan were estimated at US$ 3.9 billion in 2012-13, while imports stood at US$ 721 million. Some shift from informal to formal trade was taking place, but after the suspension of ties, informal trade is expected to grow again. The study by ICRIER makes a few policy recommendations like improving information sharing, having exhibitions and fairs for each other’s exporters, addressing impediments impacting exports by rail, and having an institutional framework to address issues. From a pragmatic perspective, Pakistan would have done itself a world of good if it discussed ways to improve its trade and business relations with India. It is no secret that the Pakistani economy is in dire straits and there are other ‘downgrades’ to worry about. Pakistan’s long-term credit rating was downgraded to ‘B-Negative’ from ‘B’ by Standard & Poor’s (S&P) in February this year amid structural weaknesses and heavy external borrowing, particularly from China. S&P admitted that Pakistan’s economic outlook and external position had “deteriorated beyond expectations). It is clear that Pakistan needs a positive political and economic relationship with India to a much greater degree than the other way around. Rather than persistently crying itself hoarse over the Kashmir bogey and supporting terrorism to escalate tensions, Pakistan would be better off working to enhance ties with India and working for the prosperity of the region.

India can be a 100% EV nation by 2030
Dr. Ashok Jhunjhunwala from IIT Madras shares his thoughts on the future of electric vehicles (EVs_ in India, the challenges to their adoption and suggestions which could help EVs become the next big thing in India. Q1. Is the Government of India’s vision of making the country a 100% EV nation by 2030 a realistic one? Why/why not? Professor Ashok Jhunjhunwala (AJ): It is indeed a realistic vision. By 2030, almost all new vehicles will become EVs. India has 15 of the 20 most polluted cities are in India. EVs will help us overcome the problem of environmental pollution. EVs will also reduce our dependence on oil imported from different countries. Fortunately, the prices of batteries are already plummeting rapidly. EVs will cost no more than petrol cars in the next 3 to 4 years. In terms of performance too, EVs will be useful in terms of various parameters. They will be far more energy-efficient (about 4 times). Due to all these reasons, the country needs to facilitate the adoption of electric vehicles. Therefore, there is no reason to believe that the new vehicles will be petrol vehicles around 2030, at least in the two-wheeler, three-wheeler & four-wheeler passenger vehicles. All the new vehicles will become electric vehicles. However, I am not sure if trucks will also be EVs. Buses also will become electric, mostly. Q2. Given factors like the enhanced availability of public transportation system and the decline in auto purchases by millennials, do you think that Indian consumers are ready to embrace this switch to EVs? AJ: EV will give better shared transport. The fact that people need to stand in long queues to get power, such as in case of Compressed Natural Gas vehicles, will not be true for EVs. You can even charge EVs at home! I, for instance, have been driving an EV car for the last four years. I have 15 amperes charging point at home which I use for charging my car overnight and it works! I use the same plug point as the one that I use for operating my air-conditioner as the one for charging my car. So, you don’t need to have big charging points. Large charging points are alternatives; but you can use these kinds of plugs everywhere and charge EVs. This battery can last even throughout the day, though it depends from vehicle to vehicle and on consumption. Q3. What challenges exist in the adoption of EVs as a popular mode of commuting in India? How can these be addressed? AJ: I see technical challenges pertaining to battery development, development of motor, development of cells, procurement of raw materials for EV production. Also, there’s the question of making these automobiles affordable and reliable for the consumers. We are just starting. In three years, we will have many options. Home charging will be the norm. The government is already working towards this; but there is a lot of work that’s left to be done. Q4. What lessons can the Indian automotive industry take from its international counterparts to bolster EVs? AJ: We will borrow whatever technology is available. We can use the knowledge from our international counterparts in the industry; but we must recast that knowledge. But note that EV elsewhere is for premium segment (for example ₹25-60 lakhs car), whereas we need affordable vehicles – two-wheelers/three-wheelers and ₹5-10 lakh car. They are mostly focused on cars which cost more ₹25 lakh; India may not need to many of those. We have to come up with new ways to manufacture ₹50,000 two-wheeler and a ₹4 lakh electric car. This is not really a question of customising foreign technology; it is a question of designing afresh. Q5. Is India capable of manufacturing EVs on its own or will it depend on countries like China and Japan to meet its technological and other production related requirements? If it is dependent on other nations, what can be done to make the industry self-reliant? AJ: We certainly can make all. Today India produces a car which costs less than ₹4 lakhs. Nobody else in the world does the same. We have certainly looked up to the world for some inspiration; but we have also learned to do it ourselves. I think the same thing can be done in the case of electric vehicles as well. The only technology for which we need tie-up is Lithium Ion battery cells. Q6. Are measures like tax breaks to EVs given in the budget consistent with WTO rules or is India heading towards inviting another international dispute? AJ: They are good. All over world EVs are getting 30% to 40% subsidy. For instance, Europe, China & USA are offering rebates to the electric vehicle industry. In the next few years, all these subsidies will be gradually withdrawn. We don’t need subsidies forever. Q7. Do you think government’s efforts to boost the adoption of EVs like FAME 2 scheme are a success? Why/ why not? If not, what suggestions do you have for the government? AJ: FAME2 will be part of what is needed. GST concessions is next step. We need incentives to manufacture cells. There are certain places where enough understanding of technology does not exist and therefore, they are making some mistakes. But they are going to make corrections in due course of time. Q 8. What are the factors that have led to the de-growth of automotive sales in India? What are the impacts that it is likely to have? What can the government do to correct this situation? AJ: Well, it is more to do with economy and will self-correct as economy picks up. Our GDP has gone for a toss; our economy is not in good shape. That is the reason why people are not purchasing consumer durables like vehicles much. Once the economic rebound happens, this demand for vehicles will be stirred up. We also need jobs to enhance the purchasing power of our consumers. Dr. Ashok Jhunjhunwala is a professor

Streamlining Food Trade through Technology and Data Analytics
• The Economic Survey 2018-19 brought forth the need for technology and data analytics in the food sector. • However, studies point out that while agencies such as the Food Safety and Standards Authority of India (FSSAI) have taken several initiatives to implement technology and automation, there are gaps in processes. • Moreover, in terms of documentation, importers and exporters are often unaware of the documentation requirements. • Integration and sharing of information across agencies and across different ports of entry will go a long way in promoting the ease of doing business in food trade. The report of the Logistics Development Committee, Economic Advisory Council to the Prime Minister (EAC-PM), October 2018, pointed out that despite various measures taken in the recent years by the central government to improve ease of doing business, there are delays and bottlenecks at the ports due to lack of predictability and certainty, resulting from manual interventions. The report recommended a shift towards a fully-facilitated trust-based clearance process through state-of-the-art risk management system. More recently, the Economic Survey 2018-19 brought forth the need for technology and data analytics in the food sector. In this context, a survey based study by the authors covering 150 respondents titled, “Streamlining Food Imports for Trade Facilitation and Ease of Doing Business in India”, published by Academic Foundation, found that while agencies such as the Food Safety and Standards Authority of India (FSSAI) have taken several initiatives to implement technology and automation, there are gaps in processes, technology adaptations and inter-agency co-ordination. These are resulting in delays and higher compliance costs. For example, even though pre-shipment filing of application has been made mandatory in the Customs’ ICEGATE portal, the FSSAI’s facility of pre-shipment filing in the Food Import Clearance System (FICS) is not mandatory and according to survey participants it is not being used by the importers. This is leading to delays. To improve ease of doing business and India’s ranking in logistics performance indicators, there is an urgent need for backend process and IT integration across different export and import clearance agencies and all agencies should make pre-shipment filing mandatory. Unless import clearance portals of other agencies are fully integrated with ICEGATE, importers have to upload the same set of documents on multiple portals, which adversely impact ease of doing business. Integration of system for real time exchange of data and information electronically between the Customs, FSSAI, and other government agencies would be necessary for a robust risk management system. The study found that opening up of the Indian economy to trade in food and feed products has led to the associated “trade” of hazards and risks, which can enter the country through imports. The FSSAI systems generate and operate on large volumes of data from various touch points with respect to importers, logistics companies, courier and express delivery bodies, food business operators, and other participating agencies. This data can be used to identify high-risk and low-risk products, importers and countries. The high-risk products can then go through more examination while low-risk products can be cleared on a fast track route. Integration and sharing of information across agencies and across different ports of entry will not only ensure uniformity of processes but will also ensure that unsafe food products do not entry the country. The survey found that since multiple clearance agencies are not putting down their requirements by a common product classification or HS codes, importers and exporters are often unaware of the documentation requirements. They often submit incomplete documents and in some cases no-objection is required from multiple agencies causing delays. Ideally, the requirements of different agencies such as the FSSAI, Agricultural and Processed Food Products Export Development Authority (APEDA), Plant and Animal Quarantines should be consolidated by product categories at HS 8-digit level in a technology based platform so that Customs and other stakeholders involved in the export and import processes are aware of the requirements and are able to verify if these are met. Unless this is done, a product cleared by an export control agency in India can be rejected or even banned in the importing country market leading to huge losses for the exporters. To conclude, the growth in agriculture trade has posed a challenge to agencies in ensuring that food adheres to safety requirements such as the maximum permitted level of pesticide and other chemical residues and are free of animal and plant borne diseases. Products can be classified under high-risk and low-risk products and can even be banned. However, such classifications should be based on scientific evidence and the rationale for such classification has to be made public and shared with importers, exporters and other stakeholders. Risk can be under various categories – importer/exporter related risk, product related risk, country related risk and so forth. These risks have to be identified by sharing information across agencies and even across countries, to understand how other countries are identifying, examining and analysing such risk and what measures have been taken to communicate and mitigate the risks. In this context, there is need to have greater collaborations with regional groups such as the European Union and countries such as the United States, Australia and Japan to understand how these countries are collating and collecting data and analysing them. With widespread digitisation, data generated through cross-border trade can help in evidence based policymaking and can be used as proof in case of any legal dispute faced by India in international forums such as the World Trade Organization (WTO). Indian government agencies engaged in trade have to build frameworks for not only collecting data but also for archival and purging of historical data. There is need to segregate the data based on usage patterns and this, in turn, will define the way data needs to be stored. Such a stance can help India leapfrog to utilise the benefits of technological advances for ensuring food safety and standards and ease of doing business. Dr. Arpita Mukherjee is a Professor at ICRIER. She has over 25 years
Product profile: Canned tuna
Tariff Line of canned/tinned tuna for India: 16041410. HS CODE is 160414. • According to forecasts, the canned tuna market is expected to grow at a CAGR of 4.67% during the period 2019-2022. • Global size of the canned tuna market was at around US$ 10.8 billion in 2017, which is expected to increase at a CAGR of 4.67% over 2019-2022, reaching a value worth US$ 12.9 billion by the end of 2022. • Thailand is the largest exporter of canned tuna with a share of around 29% followed by Ecuador, Spain and China. Top importers include USA, Italy, Spain, France and UK. • India can raise its market share to 0.5% just by addressing critical gaps in the value chain, including infrastructure, modernisation, traceability, production and productivity. Burgeoning consumer dependence on prepared and ready-to-eat food is considered to be a key driver for the canned tuna market. Global size of the canned tuna market was around US$ 10.8 billion in 2017, which is expected to increase at a CAGR of 4.67% over 2019-2022, reaching a value worth US$ 12.9 billion by the end of 2022. Canned tuna with high storage capacity is expected to drive market growth. Canned or tinned tuna is a vital source of important vitamins and minerals, such as selenium and vitamin D. Also, it has essential nutrients such as omega-3 fatty acids, high quality lean protein and healthy fat. Omega-3 fatty acids contribute to good heart health by reducing the risk of abnormal heart rhythms that can lead to sudden death. Apart from omega-3 acids, tuna is one of the few naturally rich sources of vitamin D. Vitamin D is crucial in maintaining normal blood levels of calcium and phosphorus. It helps build and maintain strong bones and prevents rickets and osteomalacia. It also prevents certain types of cancer and diabetes. Also, such nutrients are important during pregnancy and for a healthy heart and brain. Therefore, with increasing awareness of the health benefits of tuna, the market for canned tuna is expected to register a positive outlook during the forecast period. On the basis of end-markets of tuna, Japan represents the largest consumer, followed by the US, Republic of Korea and others. Based on the species, Skipjack tuna dominates the total tuna market, followed by Yellowfin, Bigeye, Albacore and Bluefin. The canning industry remains the main destination for most of the world’s tuna catches. Thailand is by far the largest exporter of processed tuna in the world. For canned products, the raw material is supplied both from local landings & imports, though by different proportions depending on the country, which becomes a part of global value chains. Top exporter of canned tuna as per 2018 Exporters Value exported in 2018 (US$ million) Unit value (US$/unit) Share in world exports (%) World 7,813.83 4,788 100 Thailand 2,256.20 4,387 28.9 Ecuador 1,109.98 4,993 14.2 Spain 681.70 6,282 8.7 China 484.76 4,582 6.2 Indonesia 387.29 4,710 5 Philippines 353.02 2,615 4.5 Netherlands 281.27 5,491 3.6 Seychelles 279.08 7,866 3.6 Mauritius 272.88 5,042 3.5 Viet Nam 262.01 4,831 3.4 Source: ITC Trade Map Thailand is the largest exporter capturing the world export basket of canned tuna of approximately 29% followed by Ecuador, Spain and China. Importers Value imported in 2018 (US$ thousand) Unit value (US$/unit) Share in world imports (%) Average tariff (estimated) applied by the country (%) World 8,254.61 5,212 100 USA 1,102.56 5,282 13.4 6.5 Italy 867.40 6,714 10.5 8.1 Spain 705.01 5,503 8.5 8.1 France 570.20 5,708 6.9 8.1 United Kingdom 552.36 5,266 6.7 8.1 Germany 460.98 5,010 5.6 8.1 Japan 377.36 5,787 4.6 5.3 Australia 238.57 5,063 2.9 3.2 Netherlands 238.41 4,948 2.9 8.1 Saudi Arabia 194.10 4,516 2.4 4.6 Source: ITC Trade Map Top importers of canned tuna include USA, Italy, Spain, France and UK. Japan is the largest Asian importing economy. The major markets for canned tuna are US, EU, Australia, Japan and few Middle East countries. However, consumption in the last decade has remained sluggish in EU and the US, and increased only moderately in Japan. It is rising in the less traditional markets of Latin America and the Far East, where the volume of imports has risen by around 50% in the last five years. The organization of the canned tuna industry is comprised of convoluted international trade networks. It is common practice in European and US industries to execute the first steps of processing in developing countries close to the main landing areas and then export semi-processed products to the facilities in developed countries for completing the process till final distribution and consumption. These networks involve trade of a wide variety of product forms across countries, which may vary in their levels of processing. India not yet a player India has a coastline that extends over 8,000 km, so it’s no wonder that the country is one of the world’s largest producers and exporters of fish and fish products. The government’s decisions to invest US$ 15 billion in cold-storage infrastructure, sanction 100 cold-chain projects in the near-term, and allow 100% foreign direct investment in the sector are all helping to boost availability of frozen fish. This sounds good news for India’s busy urban consumers who are increasingly looking for quick and easy meals. As a result, by 2020, it is expected that India’s overall processed fish market to almost double to around US$ 70 million. India is neither a major consumer of canned tuna, consuming less than 1% of its production, nor a major exporter. In 2018-19 India exported only US$ 610,000 worth of canned tuna to Qatar and Libya. Fishery resource potential of oceanic tuna in India’s exclusive economic zone (EEZ) is estimated at 213,000 tons. Yellowfin accounts for 54% of this potential followed by skipjack (40%) and Big-eye at 6%. In order to be able to manage our tuna resources in efficient manner, data on the habitat preferences and migration routes of tuna is vital. In this year’s budget Government has announced a new scheme to promote

Non-basmati rice exports: In search of new direction
• Blessed with sub-tropical agro-climatic conditions and fertile alluvial soil, India is known to be one of the top producers & exporters of rice in the world. • Exports of non-basmati rice have declined drastically by around 55% YoY during April-May, 2018, after a decline by 15.6% YoY in FY 2018-19. • This decline is attributed to government policy of hiking MSP and removing tax incentive for exporters, coupled with intense competition from competing nations. • The government should consider alternate measures of support for exporters and also help them diversify to more lucrative markets. With estimated 115.63 MT of rice production in 2018-19 according to the Ministry of Agriculture and Farmers Welfare, India enjoys the position of being world’s second largest rice producer. According to APEDA, India exported 75,99,552.15 MT of non-basmati rice in in 2018-19. The findings suggest that the top importers of India’s non-basmati rice were Nepal (9%), Benin (9%), Bangladesh (7%), Senegal (7%) and Guinea (6%). While India’s overall exports of non-basmati rice stood at 1.53 MT during April-May 2018, the figures recorded for this year amounted to 711,837 tonnes. In values terms, India’s overall non-basmati rice exports slumped to US$ 294 million in April-May FY 2019-2020 as against US$ 652 million in the corresponding period of the previous year. This follows a decline in exports by 15.6% YoY to reach US$ 3 billion in FY 2018-19. It is feared that exports could hit a seven-year low in 2019-20. Farmers vs exporters One major domestic factor that has resulted in this worrying development is the government policy of hiking minimum support price (MSP) over the last few years to enhance incomes of the Indian farmers. This drove up the cost of rice procurement and hence its selling price by around US$ 25 in the international market. For instance, Chhattisgarh, a leading rice producer, increased the minimum paddy buying price to Rs 2,500 per 100 kg in 2018 from Rs 1,750, a jump by 43% YoY. This cost is ultimately borne by the consumers, rendering it uncompetitive in comparison to India’s rivals like Thailand, Vietnam and Myanmar. The government also decided to to withdraw 5% MEIS tax incentive from April 1, 2019, despite industry demand to extend it till next year, on expiry of the current Foreign Trade Policy. At the same time, there are some external factors that have deterred India’s exports. Weak demand on account of the piling up of inventories in African countries has cut one major source of income for India’s non-basmati rice exporters. Bangladesh, which imported 1.87 million tonnes of non-basmati rice from India in 2017-18, has imported just 480,567 tonnes in 2018-19. This is because of the bumper rice production (35.3 million tonnes) in Bangladesh according to US Department of Agriculture (USDA). Source: APEDA, figures in US$ million; top markets are as per data for 2017 Stiff competition from Vietnam, Myanmar, Thailand & China has also proved detrimental to the interests of Indian rice exporters. Due higher paddy/unhusked rice prices, India could not reduce prices of parboiled rice and is trying to fight harsh competition from Thailand. Moreover, according to the industry insiders, the shipments of white rice have almost ceased since Vietnam & Myanmar are offering more than US$ 30 per tonne discount over Indian costs of non-basmati rice. The aggressive liquidation of old stocks (3-4 million tonnes) by China has also dealt a severe blow to the rice industry in India. Furthermore, China is eyeing African markets, especially Egypt to dump its rice. Given the situation in markets like Bangladesh and African countries, diversification is a must. India needs to look at its weak presence in some of the top importers of non-basmati rice like Saudi Arabia, UAE and China. Exports to Saudi Arabia and UAE have declined alarmingly over the years, while exports to China haven’t really picked up. Indian exporters face higher tariffs than Pakistan in the case of China, and similarly higher duty barriers in other ASEAN countries like Malaysia, Philippines, South Korea and Japan. This is an issue to be addressed in RCEP negotiations. The government may consider other ways to enhance incomes of farmers such as the development of food processing industry, direct cash transfer and encouraging pisciculture & livestock farming, in lieu of hiking the MSP of crops. The industry is also of the opinion that the Indian government must provide suitable tax rebates to exporters after the removal of MEIS, while ensuring compliance with WTO norms. This will help stem the decline in exports and also ensure that farmers get a good price for their produce.
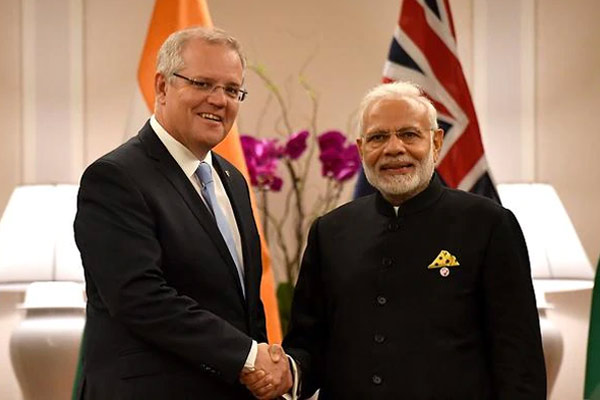
India-Australia CECA: Breaking the impasse
• India-Australia CECA is still under negotiations, even though it was supposed to get concluded in 2015. • Agriculture is a major stumbling block in talks, as India is reluctant to give market access to sectors like dairy, wine, meat and processed agro that Australia desires. • Australia is a highly competitive producer in agri-products with average returns of the top 25% of Australian farm businesses outperformed Australia’s highly paid superannuation fund managers over the past fifteen years, • Providing Australian food producers unbridled access to the Indian market would be quite untenable; however, India could provide conditional access with technology transfer to Indian producers. In the much delayed CECA and now RCEP negotiations, Australian trade negotiator is perpetually demanding market access to Indian dairy, wine, meat and processed agro sectors. India’s apprehensions in opening its markets for these sectors to Australia are a major factor behind the delay in CECA. Australia is a major agricultural exporter and also imports significant amount of foodstuffs, which indicates that their domestic markets are open to international competition. They have efficient technologies in food processing, which also nurtures opportunity for employment generation. In many cases their production systems at the farm level are unique. For example to export meat, the process starts from stage one i.e. maintaining the sheep and cattle till they are exported. During this entire process, several steps are involved including medical checkups and certifications from labs. Australia’s competitive advantages stems from a number of factors, including natural resources, climate, human resources, market proximity, technological settings and policy frameworks. It is difficult to objectively compare these factors internationally, but success in export markets provides strong evidence as to where Australia’s comparative advantages lie. More than two-thirds of all Australian agricultural production is exported, although for wool, cotton, sugar, beef and grains, exports account for more than 90% of production. Other strong export sectors include dairy, sheep meat and wine, for all of which exports account for more than 50% of production. The ability to efficiently produce pasture-fed beef, sheep meat and wool is a significant comparative advantage for Australian agriculture, especially given the growth in demand from middle-class Asian consumers. Australia is a world leader in live sheep exports and one of the largest exporters of beef, dairy cattle and goats. The quality of Australian livestock, in combination with world-leading standards of biosecurity, welfare and animal health makes it very competitive in global markets. Australian farmers are not only skilled producers of food and fibre, but they are also exceptionally good business managers. This is evident from some research the Australian Farm Institute carried out recently. It recognized that Australian farm businesses experience the highest annual revenue volatility of any sector of the Australian economy, and the second-highest revenue volatility of any international agriculture sector. Running a successful business in such a volatile environment is tough, as discovered by many corporate investors in Australian agriculture. Yet the average returns of the top 25% of Australian farm businesses have easily outperformed the returns achieved by Australia’s highly paid superannuation fund managers over the past fifteen years, confirming their business management skills. Agricultural scenario in India India’s intensity of trade in fresh fruits and vegetables is higher towards neighbouring and Middle-East countries as compared to rest of the world. However, India’s low exports in fresh fruits and vegetables are because of the use of sanitary and phytosanitary (SPS) and technical barriers to trade (TBT) measures by the developed countries. India’s trade in agriculture commodities has undergone significant changes in the post-reform period. Due to suitable climatic conditions, India’s trade has diversified towards horticulture commodities, especially exports of fruits and vegetables, as it is the second largest producer of fruits and vegetables in world. This sector not only promises increase in employment but also assures reduction in poverty as it yields higher income as compared to food grains. Over the years, the sector is moving to commercialization with increase in usage of technology and modern methods of production. The government is introducing policies especially for the horticulture sector. However, the Indian food industry does not have trained manpower to handle post-harvest quality management practices and food processing activities. There is an urgent need to train labourers engaged in post-harvest practices and shop floor workers engaged in food processing activities (Deodhar, 2001). According to the existing literatures, story still remains static since two decades. Provide access, with conditions attached India may opt for agreeing on giving partial market access only when similar technology is implanted and practiced by Indian stakeholders, once training and capacity building is done by Australian counterparts on their cost. Given Australia’s competitiveness, this seems pragmatic to implement with RCEP negotiations running parallelly. Similar to BoT (Build operate & transfer), which is implemented in India’s construction sector, there could to be an analogous policy instrument while negotiating trade agreements. This basically indicates the assistance, and nurturing the enervated industries of the respective economies via importing technology and training. Since Australia is a seasoned economy in these sectors it could assist India to achieve similar productivity by exporting technology and skills and developing infrastructure. For example to develop India’s processed dairy, meat, wine and horticulture sectors Australia could assist in implanting technology which will facilitate our manufacturer and exporter to link into global value chains, boost productivity and efficiency of the sector, and skills of workers. As a reciprocal gesture, India could offer land, economical labor and incentivise trade policies like national treatment of manufactured products. It could take a cue from Brazil, which evolved as a veteran exporter after facing tremendous rejections from EU in early 1980s. They have invested near about two decades to improve their quality. It is an opportune time for India to take the leap, and the trade agreement could be reoriented so that both India and Australia benefit.

Country Profile: Brazil
• Brazil is the 8th largest economy in the world according to PPP (Purchasing Power Parity) and 9th on nominal basis. • Newly elected president Jair Bolsonaro is attempting various stimulus measures to revive the economy, suffering from the impact of the recession in 2015-16. • India’s exports to Brazil reached an all-time high in 2014 at US$ 7.1 billion, after which Brazil was hit by the recession that impacted exports. • Brazil is signalling an openness to free trade of late, and it is an opportune time for both countries to explore and exploit complementarities in the relationship. Expansion of the India-MERCOSUR PTA needs to be expedited. Brazil is the 8th largest economy in the world according to PPP (Purchasing Power Parity) and 9th on nominal basis. GDP reached US$ 2.31 trillion in 2018 (World Bank, constant 2010 US$), growing by 1.1% YoY. Simultaneously it is also recovering from the recession that hit the economy in 2015 and 2016, and is ranked as the worst in its history. GDP shrunk by 7% during that period. The risk continues to persist, as Brazil’s economy contracted by 0.2% in the first quarter of 2019. Plummeting commodity prices, reduced export revenues and investment have enervated Brazil’s real (the country’s currency) revenues. The weaker real made existing public debt, which was largely denominated in foreign currency, more expensive. Lower tax revenues strained the government budget. Sanctions against some of the largest firms post-2015 in Brazil have limited their business scope and opportunities. In addition, foreign investment in these companies has declined because of the scandals. Under its new president President Jair Bolsonaro who is a passionate advocate of free markets, Brazil is trying various stimulus measures including a US$ 11.2 billion injection for workers in the form of a severance fund. Employers pay into this fund, and workers will be permitted to withdraw upto 500 reais or US$ 133 per year. Brazil is a member of the Common Market of the South (Mercosur), a trade bloc including Argentina, Paraguay, Uruguay, and Venezuela. After the Asian and Russian financial crises, Mercosur adopted a protectionist stance to guard against exposure to the volatility of foreign markets. Brazil and its Mercosur partners have pledged to open the bloc to more trade and investment, but changes require approval of all five members, which makes policy adjustments too difficult to enact. Recently, the bloc signed an agreement with the EU and Bolsonaro is now looking optimistically towards a MERCOSUR-US trade deal. Macroeconomic Snapshot of Brazil GDP, at nominal prices US$ 1.89 trillion GDP per capita at nominal prices US$ 9,160 GDP per capita at PPP US$ 16,727 Unemployment rate 12.5% HDI score & HDI rank 0.759 & 79 Contribution of agriculture, industry and services in GDP as a % 5.5%, 18.5% & 76% respectively Ease of doing business ranking 109 GDP growth rate, in % -0.2% Poverty ratio 25% Inflation 3.58% Credit ratings BB by fitch rates Coffee carries a special place in Brazil’s economic history. Brazil benefitted from swift growth of coffee consumption in the late 19th century, with the country producing nearly 75% of all coffee produced globally around the turn of the century. It made the country very reliant on this sector. It is evaluated that coffee exports were equal to more than 10% of Brazil’s GDP. But, due to overproduction and a fall in demand due to the global recession, the coffee prices fell 50% in past century. Engineering a tough comeback Lowering trade barriers remains a priority for Brazil to increase exposure to international competition and strengthen incentives for productivity improvements. More educated workforce, less tax distortions and better infrastructure would support productivity improvements. To reconcile the need for further reductions in income inequality with diminishing fiscal space, social expenditure should focus more on most efficient policy instruments, particularly conditional cash transfers. This would accelerate the decline in income inequality without increasing spending. In the absence of a strong labor market revival, consumer spending is not expected to pick up sharply in the near term. After declining for the last three quarters of 2018, unemployment has been edging up this year with the number of unemployed at around 13 million. Low consumer demand is, in turn, weighing on production and investments. Consumer sentiment in Brazil continues to be impacted, as they are in a low-growth environment with not much to show for earnings and employment growth. Naturally, in such a scenario characterized by weak demand, businesses have not filled the gap with higher capital spending, especially as there is still quite a bit of room to utilise excess capacity. Source: ITC Trade Map Table 1: Trade flows and partners of Brazil Top export destinations of Brazil Top sources of import for Brazil Top exported products of Brazil Top imported products of Brazil China China Soya beans Medium oils of petroleum USA USA Petroleum Light oils of Petroleum Argentina Argentina Non-agglomerated iron ores Light vessels and fire floats Netherlands Germany Non-coniferous chemical wood pulp Crude oil Chile Brazil Oilcake and other solid residues Floating or submersible drilling India and Brazil share amenable and multifaceted relationship at bilateral level as well as in plurilateral platforms such as BRICS, BASIC, G-20, G-4, IBSA, International Solar Alliance, and in the larger multilateral bodies such as the UN, WTO, UNESCO and WIPO. The decade long bilateral strategic corporation is based on a common global vision, shared democratic values, and a commitment to bolster economic growth with social inclusion for the welfare of the people of both countries. Source: ITC Trade Map India’s export to Brazil reached all-time high in 2014 at US$ 7.1 billion, after which Brazil was hit by the recession. Exports reached US$ 3.8 billion in 2018-19 compared to imports of US$ 4.4 billion, leading to a deficit of US$ 605.9 million. India’s top exports to Brazil include insecticides and fungicides, synthetic yarns, accessories for automobiles, medicaments, waste oils, heterocyclic compounds, carbonic acids. On the other hand, Brazil’s exports to India consists of petroleum oils,

“Tea should be put in negative list of RCEP”
Granting access to the tea market under RCEP will be disastrous for the Indian tea industry, especially due to the yearly surplus of indigenous tea and an insignificant market size and growth potential in RCEP countries. On the other hand, countries like China will have an unprecedented opportunity to flood India with cheap imports. India produces around 1,350 million kg of tea, out of that 1,220 million kg is CTC and 130 million kg is Orthodox & Green tea. India consumes mainly CTC tea. It imports 20 million kg, consumes 1,000 million kg and exports 250 million kg. Thus absorption level (consumption plus export) has not kept pace with production level, resulting in oversupply year after year. Growth in production in the last few years is attributed to the emergence of the small grower/bought leaf sector that contributes to 50% of the total production and is growing steadily. Due to oversupply of 70/80 million kg every year, the industry has been suffering from depressed prices in the past 6-7 years. India makes all types of tea, which all other producing countries together produce. There are some vulnerable areas like Cachar (55 million kg production), Dooars (235 million kg) & Terai (160 million kg), which cater exclusively to the domestic market and would suffer in the event of an influx of imports. The government’s imposition of 100% import duty has kept the Indian tea industry protected so far. But the industry sees a potential threat with the opening of its market to RCEP countries, if tea is brought under the ambit of FTA, leading to dilution of Rules of Origin through change in Tariff Classification & PSR and zero/lower import duty. In the RCEP, there are 16 countries which want a free trade agreement for free imports & exports of goods within the block. Now, if you go through the trade within that block in individual countries, you’ll find that that trade is not in India’s favour – import contents exceed that of exports. There are countries like China, Japan, Vietnam and Indonesia in the block, which also make tea apart from India. Exports of Indian tea to this block is limited to 18-20 million kg. On the other hand, India has a market of over 1,000 million kg, which is growing at @2.3% annually. On signing FTA, RCEP countries will get this big ready market that will be disastrous for the Indian tea industry. When we look at the import and export content of tea in RCEP bloc, we find that our exports to China are 10 million kg and to other countries in the block are around 8/10 million kg. Thus there is very limited opportunity to increase tea exports because China, Japan, etc are mainly green tea consuming countries. China, apart from making green tea, also makes sizeable quantity of black tea which is not sought after in its own market. China will then target India’s black tea market and flood it. It is difficult for China to expand exports to US, Western countries or Middle East, which are mainly black tea markets and almost saturated. Every country maintains high tariffs on certain products to protect its farmers and labour intensive industries or to promote manufacturing. India should be no different. Developing countries need to protect their indigenous industries and millions of workers, traders, etc associated with them. India’s tea production cost is the highest in the world as it bears lot of social welfare costs apart from high transportation costs. In fact, no other industry in India or tea industry in any other country bears those costs. In the last 6 years, production cost has increased at a CAGR of 10%, while price has not kept pace (CAGR of 1%). The financial condition of the Indian tea industry is critical due to supressed price and rising cost. In the midst of this, if the government allows imports of tea, it will be disastrous for the Indian tea industry. We have requested the government to pragmatically look into the issues and put tea into the negative list of RCEP, where there would be no negotiation on either export or import of Tea and no dilution of import duty from 100% on the following grounds: • Indian tea industry provides employment to over 1.2 million workers directly and another 6 million associated with the industry. Around 50% of the workforce is women. • Indian tea suffers from over-supply, stagnant prices and significant mismatch in demand & supply. • Low CoP in many RCEP nations will enable export of tea at much lower price. Teas from those countries would be cheaper even after payment of 100% import duty. • Limited scope of exports of Indian teas within the RCEP bloc when huge scope for other countries exists to enter into the big Indian tea market. The tea industry strongly suggests that instead of going into the hurdles of negotiation, it should be put in the Negative List of FTA to protect interests of the industry and millions of people associated with it. There should be no dilution of PSR and Rules of Origin or reduction of import duty for the tea sector. Mr Sujit Patra is Secretary, Indian Tea Association (ITA) the largest & oldest tea organisation in India. He has been working with the ITA for more than 30 years. Mr Patra is directly involved in multi-functional areas like domestic & overseas tea promotion exercises, market analysis, financial planning, supplies & transportation, general administration, MIS and liaison with various government depts, embassies, etc on all aspects of the tea industry.

“We need to focus on enhancing the yield of coffee”
In his interaction with TPCI, Dr. D.R. Babu Reddy, Deputy Director (Market Research), Coffee Board of India, talks about the challenges faced by Indian coffee exporters, the strategies to bolster the country’s coffee exports and the roadmap for the industry over the next few years & more. Q. How is the Indian coffee industry placed in the global landscape? What is the aspiration that the industry sets for itself in the coming 5-10 years – vis-a-vis export volume/value growth, brand equity, domestic consumption, etc? Dr. Babu Reddy: India, in terms of production, used to be at the 6th place in the past. It has now slipped to the 7th position, losing its place to Honduras. India produces around 3.2 lakh metric tonnes of coffee. Arabica accounts for around 30% of the total coffee production in India, while the remaining is Robusta. We moved to the 5th position in exports a few years ago. However, we have now tumbled to the 6th position. Indian coffee exports comprise of the coffee produced in the country as well as re-exports of imported coffee brought in for value addition to instant coffee and then exported. The latter contributes to about 20-25% of the total coffee exported by India. The duty free import of coffee for value addition and re-exports under the Foreign Trade Policy route has contributed to the emergence of India as a global hub for instant coffee production, with instant coffee exports contributing to 30% of India’s total coffee exports. In terms of the volume growth of exports, there’s not much scope for substantial increase as there are limitations to our production capacity due to factors like the paucity of land for expansion in our traditional coffee growing states –Karnataka, Kerala & Tamil Nadu. However, we need to focus on enhancing the yield of coffee in order to boost our exports. At the same time, the coffee growing areas are expanding in non-traditional areas like Andhra Pradesh, Odisha and Northeastern states, where coffee is cultivated by tribes. However, their yields are very low as compared to other regions and cultivation is organic by default. Therefore, the volume increases should be seen in terms of the value addition to coffee. Our focus is mainly on the value earnings, that is premiumisation of Indian coffee, focus on uniqueness of Indian coffee, like shade grown, eco-friendly etc. Our Robustas get high premiums in the international market. Q. What is the strategic roadmap you have set to achieve these aspirations in collaboration with the industry? Dr. Reddy: In terms of export-oriented strategy, the Coffee Board is a facilitator. Promoting coffee trade – nationally & internationally – has always been the focus of the Board’s attention. Our approach includes participation in events, conducting BSMs, cupping competitions, Flavours of India, having buyer-seller interactions and advocating the sustainability of Indian coffee – its greatest USP of being shade-grown and sun-dried. GI tag has been granted to the Monsoon Malabar coffee in 2008. During March’19, we got the GI tag for 5 more regional coffees grown in Wayanad (Robusta coffee) and Bababudangiris, Chikmagalur, Coorg & Araku valley (for Arabica). We have also got state-of-the-art laboratory infrastructure to enhance the quality of coffee under the Trade Infrastructure for Exports Scheme (TIES). We are upgrading our quality lab to suit the international standards. A lot of initiatives have also been taken under the ease of doing business. For instance, initiatives related to easier online documentation process for the exporters have already been taken. Q3. How is Indian coffee placed as a brand vis-a-vis its foreign counterparts? Dr. Reddy: Though we’re the 5th/6th largest exporter, our share in the international market is hardly 5% in terms of the total exports when compared with say Brazil (35%), Vietnam (20%) & Columbia (15%); & in terms of the total global production it is hardly 3.5%. As a brand, Indian coffee may not be the first choice for everyone, but it has carved a niche for itself because it is blended for many of the top brands. Indian Robustas are used being by the traditional market players. Our focus is now towards branding of Indian coffee. Q. What are the major current and potential markets that India is targeting for its coffee? Is India facing any significant tariff/non-tariff barriers in these markets? Dr. Reddy: Indian coffee goes to more than 100 destinations, of which European Union has more than 55% share. Russia & CIS countries are also top destinations for Indian coffee exporters. For India’s instant coffee, Turkey is also emerging as another popular destination. Apart from these markets, we’re focusing on US, Canada, Japan, South Korea, Australia and New Zealand. Scandinavian countries are more preferred for specialty coffee. Unlike other commodities, there are no major tariff/non-tariff barriers faced by coffee exporters. One reason for this is that it is being consumed in the developed world, where there’s no significant coffee production. Duties are very low and more or less at zero levels. Wherever small duties are there, they’re being taken off by the bilateral & multi-lateral agreements. But overall, these are not major challenges. SPS/TBT issues are also not major for coffee, as it can be stored and kept for 6 months to one year. Q. What practical difficulties are being faced by coffee growers in India? How is Coffee Board helping them resolve these issues? Dr. Reddy: Climate change is a major obstacle for Indian coffee growers and impacting production. There are also labour-related issues related to rising costs and prices being highly volatile and at a relatively lower level. Arabica is not faring that well with concerns on the white stem borer issue, so that’s a challenge. Infrastructural bottlenecks hinder coffee cultivation too. Coffee Board through its vast Research & Extension network provides technology as well as developmental support for improving production, productivity and quality of coffee in plantations as well as encouraging value addition in the sector. Q6. What are the challenges to greater market penetration within India and how